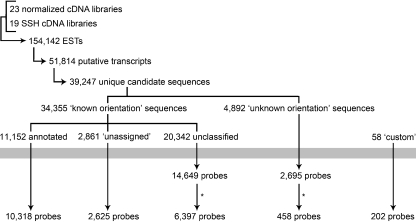
Fig. 1.
Sequence selection and probe design. Flowchart of the procedure of selection of representative candidate sequences and probe design. In this flowchart, arrowheads indicate a reduction in the number of sequences. The gray bar indicates the probe design process. Asterisks indicate an additional probe selection procedure based on the number of ESTs contributing to each contig sequence (for probes from “unclassified” sequences) or on the abundance in SSH libraries and predicted roles in immune and stress responses (for probes from “unknown orientation” sequences). For more details on the probe design process, see “Materials and Methods” and ESM Fig. S1

