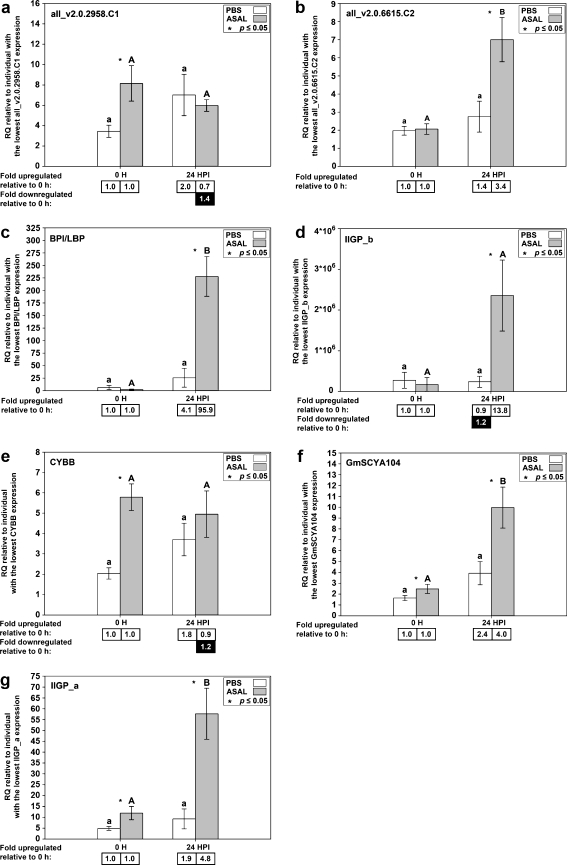
Fig. 5.
QPCR results for genes identified as Asal-responsive by microarray only. Average relative quantity (RQ) values with SEM error bars. Gene expression differences were determined by t tests on RQ values with a p value cutoff of 0.05. Statistically significant differences between treatments within time points are indicated with an asterisk. Statistically significant differences between time points within treatments are indicated with letters (lowercase for PBS, uppercase for A. salmonicida; different letters indicate significant difference). Fold upregulation was calculated as (average RQ 24 HPI)/(average RQ 0 h) for both PBS and Asal groups. Fold downregulation was calculated as 1/(fold upregulation)

