
Figure 4.
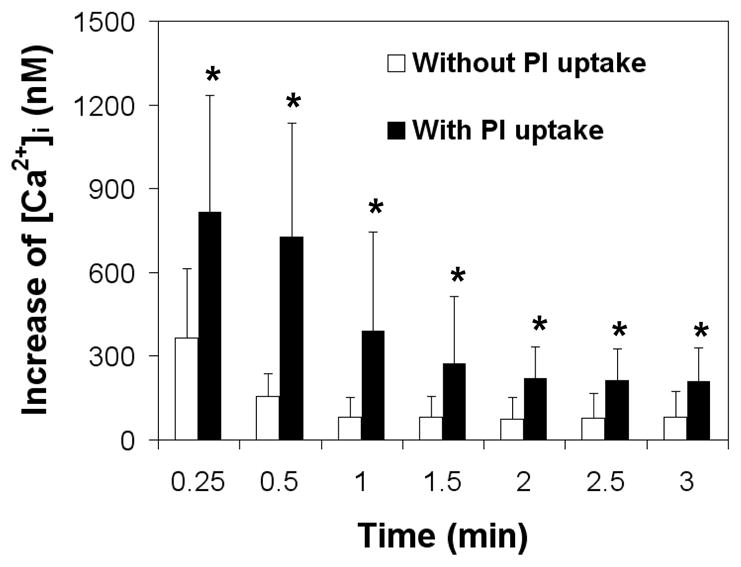
Different changes in Mean [Ca2+]i after sonoporation (1.25 MHz, 10 cycles, 0.24 MPa peak negative pressure) for cells with PI uptake (n = 14) and without PI uptake (n = 10). All the cells exhibited immediate change of [Ca2+]i after US application. The asterisk indicates P < 0.05 for a Student’s t-test between cells with and without PI uptake cells at each time point.