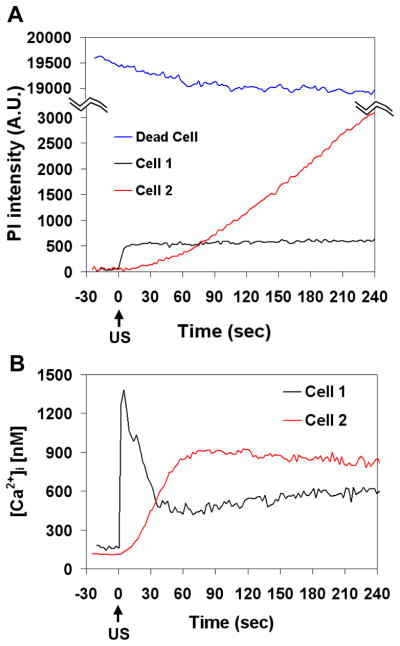
Figure 6.
Plots of mean PI intensity and [Ca2+]i showing difference for surviving and non-surviving cells. (A) Mean PI intensity and (B) mean [Ca2+]i vs. time for Cells 1, 2 and the dead cell for the regions of interest in Fig. 5 outlined by the dotted white lines on the main body of the cells.

