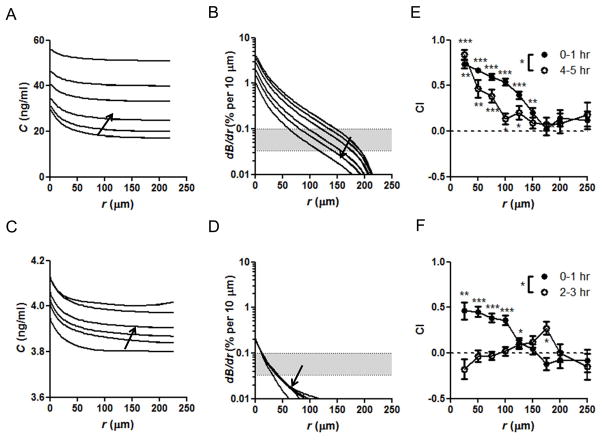
Fig. 5. Relationship between microsphere-generated chemoattractant gradients, receptor occupancy, and migration responses.
(A–D) Simulated chemokine concentration gradients developed around an isolated 50 μm-diameter alginate microsphere releasing CCL21 (A, B) or CXCL12 (C, D), calculated from experimentally-determined release rates of particles incubated with 25 μg chemokine/mg alginate during loading. Shown are the chemoattractant concentration (C) (A, C) and chemokine receptor occupancy gradients (dB/dr) as a function of distance to the surface of microsphere (r) (B, D) at 15 min, 0.5 hr, 1 hr, 2 hr, 3 hr, and 5 hr; arrows indicate the trend of increasing time. Shaded areas in B, D indicate the estimated threshold of gradients in receptor occupancy required for directional migration for cells expressing 10, 000 to 30, 000 receptors. (E, F) Mean chemotactic index (CI) of activated human T-cells migrating through collagen gels in the vicinity of isolated microspheres releasing CCL21 (E) or CXCL12 (F) as a function of distance from the microspheres (r); shown are mean CI ± SE determined from 1-min time steps of cells analyzed in the indicated window of time after start of the experiment; dashed lines indicate the expected CI for random migration (zero); values significantly different from zero are indicated: * P<0.5, ** P<0.001, *** P<0.0001. CIs determined for (E) n = 107 cells (0–1 hr) and n = 45 cells (4–5 hr); * P<0.05; (F) n = 67 cells (0–1 hr) and n = 59 cells (2–3 hr); * P<0.05.

