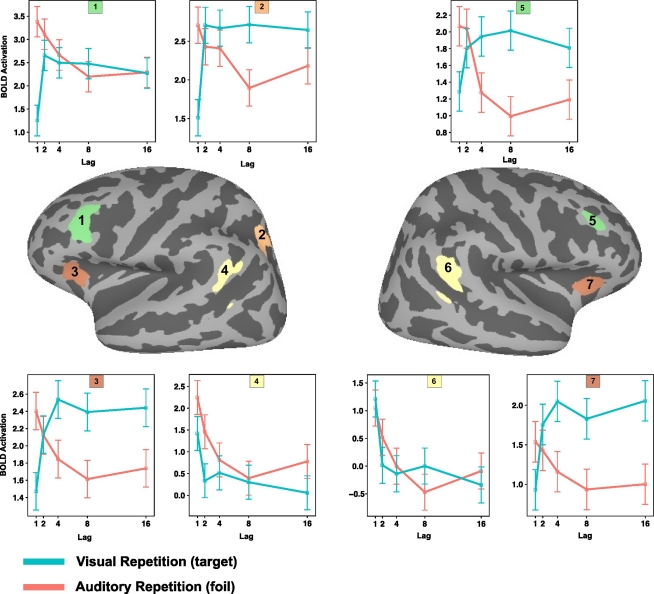
Figure 4.
Mean level of activation as a function of lag and source modality in selected regions of interest (1–7). 1. Left dorsolateral prefrontal cortex. 2. Left intra parietal sulcus. 3. Left anterior insula. 4. Left inferior parietal lobe. 5. Right dorsolateral prefrontal cortex. 6. Right inferior parietal lobe. 7. Right anterior insula.

