Figure 5.
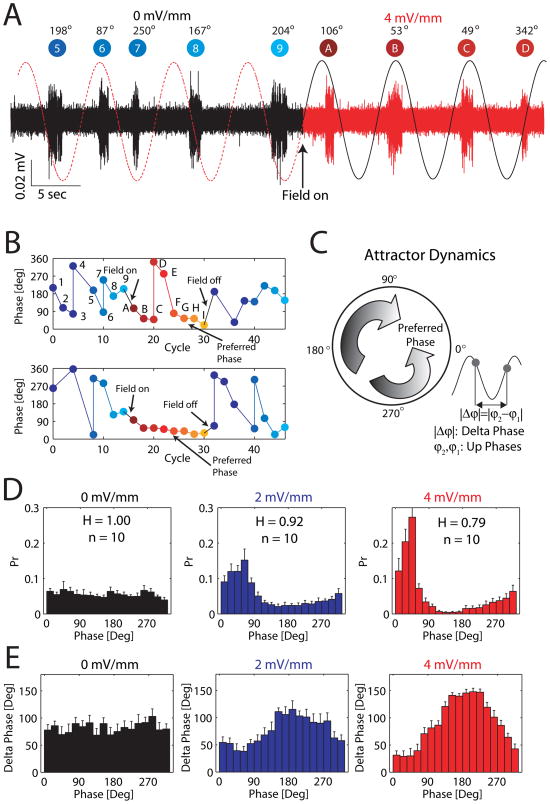
Sine-wave field entrains Up states. (A) Left (black): Slow oscillation in control condition (0 mV/mm; no applied field). Dashed line represents “virtual extension” of applied sine wave. Right (red): Slow oscillation with sine-wave EF (4 mV/mm). Up states are marked with a label and their respective phases are shown. (B) Representative examples of Up state phase as a function of cycle number of the Up state. (C) Left: Schematic representation of preferred phase as an attractor. If the phase assumes a value outside the basin of attraction for a given Up state (e.g. Up state “D”), the phases of the consecutive Up states rapidly change such that they converge back to preferred phase. Right: Schematic representation of phase difference |Δϕ| as the absolute value of the difference between the two phases of two consecutive Up states. (D) Up state phase distribution for control, 2 mV/mm, and 4 mV/mm applied sine wave fields (Pr: Probability). Peak of phase histogram indicates preferred phase (n = 10). Normalized entropy H measures how uniform the phase distribution is. (E) Absolute phase difference |Δϕ| of all consecutive Up state pairs (ϕ1, ϕ2) as a function of phase ϕ1 is largest for values that are farthest from the preferred phase. See also Figure S5.

