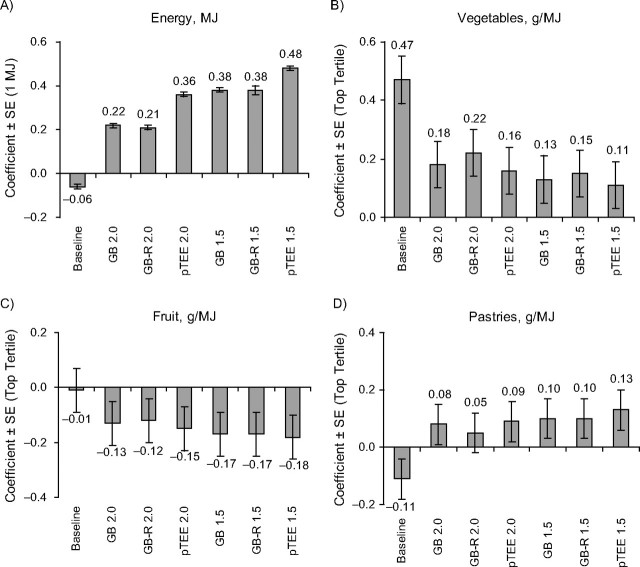
Figure 2.
Associations between dietary intakes and body mass index among men, determined using alternative adjustments for estimated under- and overreporting, in the Spanish cohort of the European Investigation Into Cancer and Nutrition, 1992–1996. Coefficients from multivariable linear regression models adjusted for age, center, height, activity, educational level, smoking status, season, alcohol intakes, parity, diabetes, and use of special diets. We adjusted for energy and fat simultaneously, and food group models (intakes in g/MJ) adjusted simultaneously for all food groups. Food group intakes are shown in nonsmokers (69% of men), as there was an interaction with smoking status. Coefficients for energy were significant in all models. For fruit, coefficient P < 0.05 in the following models: Goldberg method, 1.5-standard-deviation cutoffs (GB 1.5), revised Goldberg method, 1.5-standard-deviation cutoffs (GB-R 1.5), and predicted total energy expenditure (pTEE) method, 1.5-standard-deviation cutoffs (pTEE 1.5); coefficient P < 0.10 for pTEE method, 2.0-standard-deviation cutoffs (pTEE 2.0). For vegetables, coefficient P < 0.05 in the following models: baseline, Goldberg, 2.0-standard-deviation cutoffs (GB 2.0), revised Goldberg method, 2.0-standard-deviation cutoffs (GB-R 2.0) and pTEE 2.0; coefficient P < 0.10 for GB-R 1.5. For pastries, coefficient P < 0.10 only for the model adjusting for misreporters identified using pTEE 1.5. Bars, standard error (SE).

