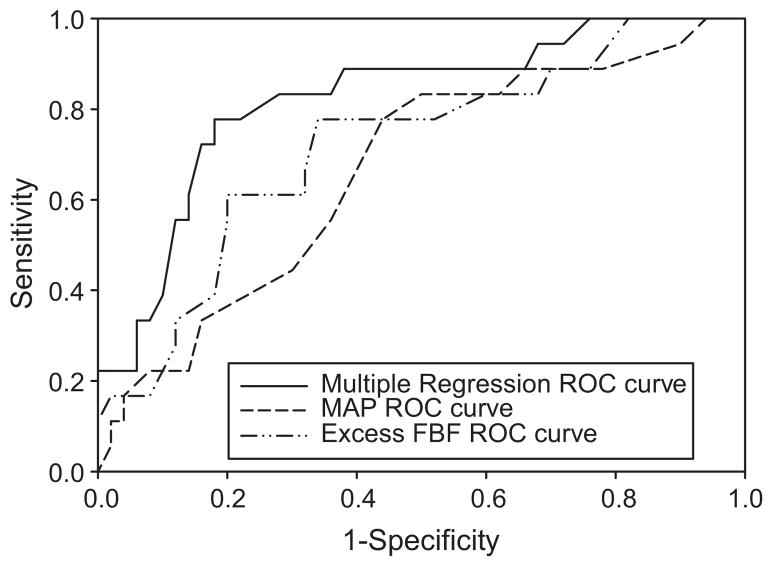
Figure 2.
Receiver operating characteristic (ROC) curves for various logistic regression analyses. The multiple logistic regression equation used to construct the ROC curve (solid line) was logit(y) = −5.56 + (−0.551•excess FBF) + (0.141•MAP) + (−1.972•BSA), with the area under the curve of 0.82. Univariate logistic regression equation used to construct the ROC curve for excess FBF (dash-to-dot line) was logit(y) = 0.573 + (−0.364•excess FBF); with the area under the curve of 0.71. Univariate logistic regression equation used to construct the ROC curve for MAP (dash line) was logit(y) = −6.269 + (0.063•MAP), with the area under the curve of 0.66.

