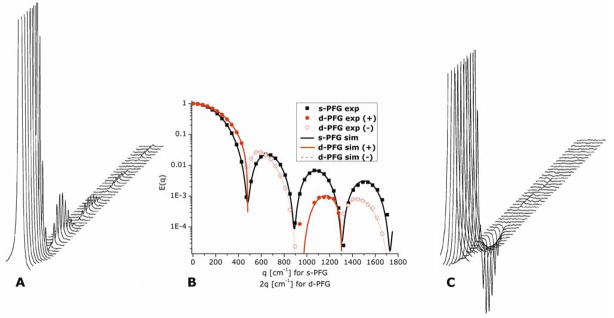
Figure 5.
Stackplots and E(q) plots of s- and d-PFG experiments. (A) The stackplot from a s-PFG experiment conducted on microcapillaries with ID=25±1 μm with Δ/δ=150/3 ms. The diffusion-diffraction minima can be easily observed. (B) Experimental (symbols) and theoretical fittings (lines) for single- and double-PFG (black squares and red circles respectively). Note that d-PFG negative experimental data and negative theoretical fitting are plotted as absolute values (hollow red circles and dashed red line respectively). The data of d-PFG is plotted against 2q for d-PFG, to enable easy comparison with s-PFG. (C) The stackplot of a d-PFG experiment conducted on the same microcapillaries with Δ1=Δ2/δ1=δ2=δ3=150/3 and with tm=0 ms. Note the actual zero-crossings of the signal, after which the phase of the signal is inverted with respect to the initial phase.

