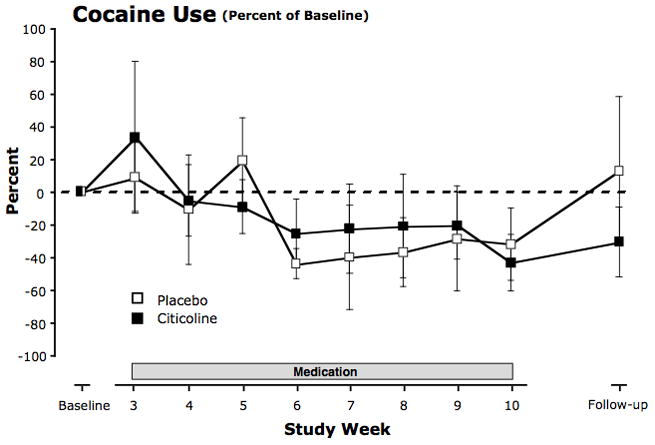
FIGURE 4.

Percent change in craving for cocaine during the eight treatment weeks and during the six-week follow-up period. Craving was reported in the daily diary on a 10-point Likert-type scale ranging from 0 (none at all) to 10 (extremely high). Each recording occurred in the morning and reported on craving during the previous 24 hours. For each participant, percent changes in daily craving ratings from baseline were averaged over each week of the treatment period and over the six-week follow-up period. Means across subjects were then calculated for each timepoint. Values are means ± SEM.
