
Figure 3.
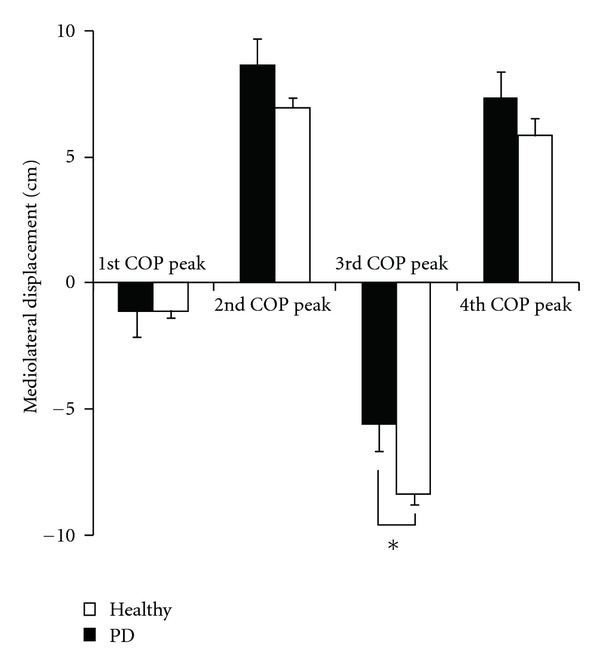
Mediolateral displacement of COP peaks. Data columns indicate the mean, and error bars indicate standard errors of the mean. An asterisk indicates a significant difference between the groups (P < 0.05).
Official websites use .gov
A
.gov website belongs to an official
government organization in the United States.
Secure .gov websites use HTTPS
A lock (
) or https:// means you've safely
connected to the .gov website. Share sensitive
information only on official, secure websites.
Mediolateral displacement of COP peaks. Data columns indicate the mean, and error bars indicate standard errors of the mean. An asterisk indicates a significant difference between the groups (P < 0.05).