
Figure 1. A Mosaic of GFP+ On-Off RGCs in DRD4-GFP Mice.
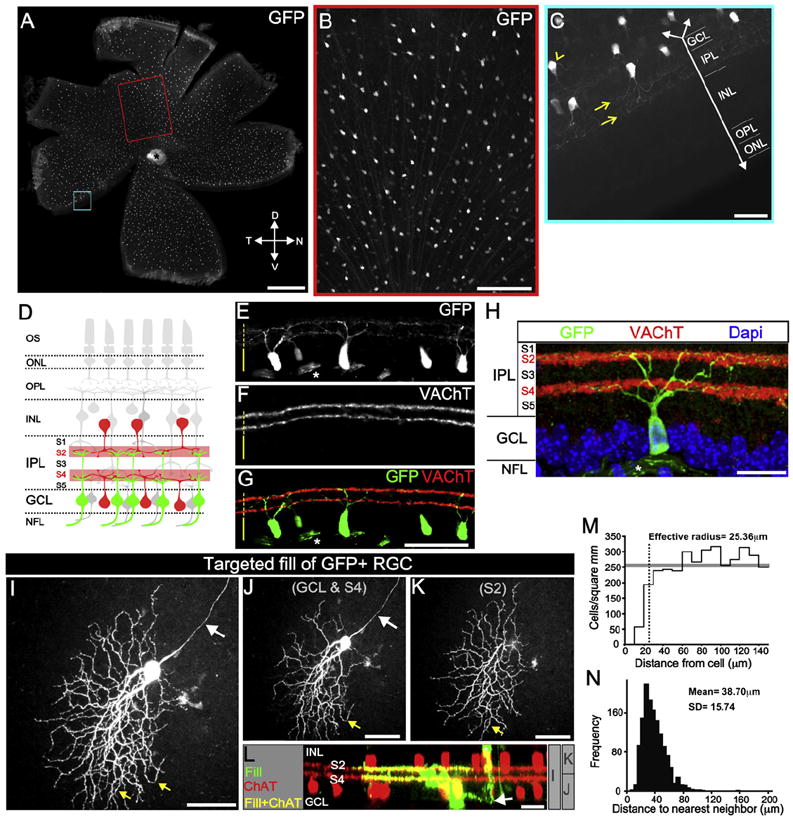
(A) Fluorescence image of whole-mount DRD4-GFP retina. T, temporal; N, nasal; D, dorsal; V, ventral. Scale bar, 500 μm.
(B) Red-framed region in (A). Scale bar, 200 μm.
(C) Blue-framed region in (A). Downward arrow, axis perpendicular to retinal layers. GFP+ dendrites (yellow arrows) in the inner plexiform layer (IPL). INL, inner nuclear layer; OPL, outer plexiform layer; ONL, outer nuclear layer. Arrowhead, GFP+ axon. Scale bar, 50 μm.
(D) Starburst amacrine cell (SBAC) somas (red) and dendrites (pale red) in IPL sublamina 2 (S2) and S4. On-Off DGSCs (green) project dendrites to S2 and S4. Labels as in (C), plus NFL, nerve fiber layer; and OS, outer segments.
(E–H) DRD4-GFP retinas stained for GFP (E), VAChT (F), and merged (G and H). Asterisks, GFP+ axons. Dashed line, IPL. Solid line, GCL. (E–G) Scale bar, 100 μm.
(H) Scale bar, 50 μm.
(I–L). Biocytin-filled GFP+ RGC and ChAT+ SBACs. (I) Complete view of filled RGC. White arrow, axon. Yellow arrows, “looping” arborizations. (J) The portion of the RGC in GCL-S4 and, (K) in S2. (L) Side view of the filled RGC (green) and ChAT+ SBACs (red) and their overlap (yellow). Arrow, axon. Asterisk, amacrine cell. Gray bars, depths of view for (I)–(K). Scale bar, 50 μm (I–K) and 25 μm (L).
(M) Density recovery profile (Rodieck, 1991). Gray bar, average cell density. Dashed line, effective radius, within which it was rare to observe another GFP+ soma.
(N) Distribution of the distances between nearest-neighbor GFP+ RGCs.