
Figure 3. On-Off pDSGCs Form Laminar-Specific Connections in the dLGN.
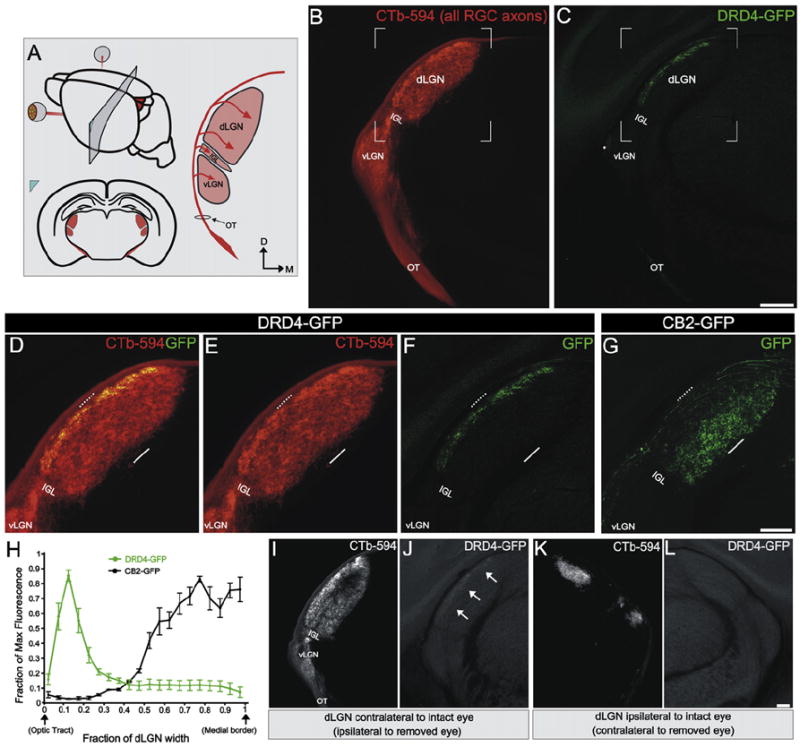
(A) Schematic of region shown in (B)–(L) and RGC axons entering the dLGN (arrows). Red, RGC axons from both eyes labeled with CTb-594; OT, optic tract; vLGN, ventral lateral geniculate nucleus; IGL, intergeniculate leaflet; dLGN, dorsal lateral geniculate nucleus. D, dorsal; M, medial.
(B) CTb+ RGC axons at the level depicted in (A). (C) GFP+ On-Off pDSGC axons at the level depicted in (A). (B and C) Scale bar, 400 μm.
(D–F) Area framed in (B) and (C). Dashed line, lateral dLGN; solid line, medial dLGN. (D) Merge of CTb+ and GFP+ RGC axons. (E) CTb+ RGC axons. (F) GFP+ On-Off pDSGC axons.
(G) GFP+ tOff-αRGCs axons (Huberman et al., 2008). (D–G) Scale bar, 200 μm.
(H) Fluorescence intensity across the dLGN width in DRD4-GFP and CB2-GFP mice. (n = 2 CB2 mice and n = 3 DRD4 mice; ±SEMs).
(I–L) CTb+ (I and K) and GFP+ (J and L) axons in the in dLGN contralateral (I and J) and ipsilateral (K and L) to the intact eye of a DRD-GFP mouse with one eye removed. (J) arrows, GFP+ On-Off DSGC lamina. (L) No GFP+ axons are present. Scale bar, 100 μm.