
Figure 4. On-Off pDSGCs Form Laminar-Specific Connections in the SC.
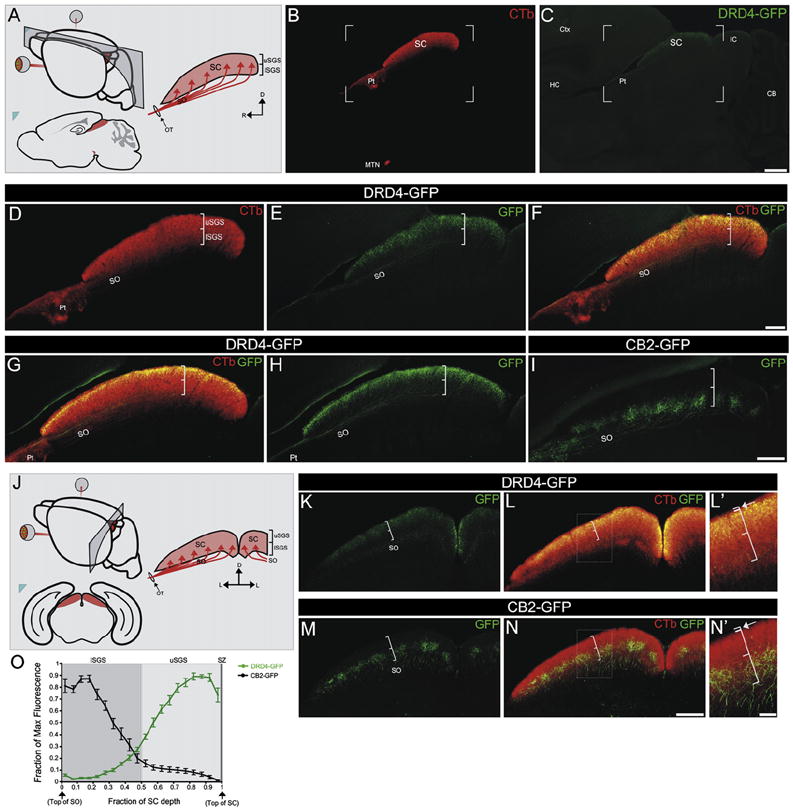
(A) Schematic of regions shown in (B)–(I) and sagittal view of RGC axons entering the SC (red arrows). SC, superior colliculus; SO, stratum opticum; brackets denote the uSGS (upper stratum griseum superficialis) and lSGS (lower stratum griseum superficialis). R, rostral; C, caudal; D, dorsal.
(B) CTb+ axons in the SC. Pt, pretectum; MTN, medial terminal nucleus. (C) GFP+ On-Off pDSGC axons in the SC. (B and C) Scale bar, 500 μm.
(D–F) Framed area in (B) and (C). (D) CTb+ axons in the SO and SGS. Brackets denote uSGS and lSGS as in (A). (E) GFP+ On-Off pDSGC axons in the SO and uSGS. (F) Merge of (D) and (E). Scale bar, 200 μm.
(G) Merged view of CTb+ and GFP+ On-Off pDSGC axons in the SC and (H) GFP+ axons viewed alone. (I) GFP+ tOff-αRGC axons targeting the lSGS, wherein they form columns (Huberman et al., 2008). (G–I) Scale bar, 200 μm.
(J) Schematic of the region in (K)–(N) and coronal view of RGC axons entering the SC. L, lateral.
(K–L′) GFP+ On-Off pDSGC axons (K) and merged with CTb+ axons (L) in the SC. (L′) Boxed region in (L). Brackets denote lSGS and uSGS. The thinner bracket (arrow) straddles the stratum zonale (SZ), a thin retinorecipient lamina above the uSGS.
(M–N′) GFP+ tOff-αRGC axons (M) and merged with CTb+ axons (N) in the SC. (N′) Boxed region in (N). Conventions as in (L′).
(K–N) Scale bar, 200 μm. (L′ and N′) Scale bar, 50 μm.
(O) Fluorescence intensity along the SC depth in DRD4-GFP and CB2-GFP mice (n = 5 CB2 mice and n = 5 DRD4 mice; ±SEMs).