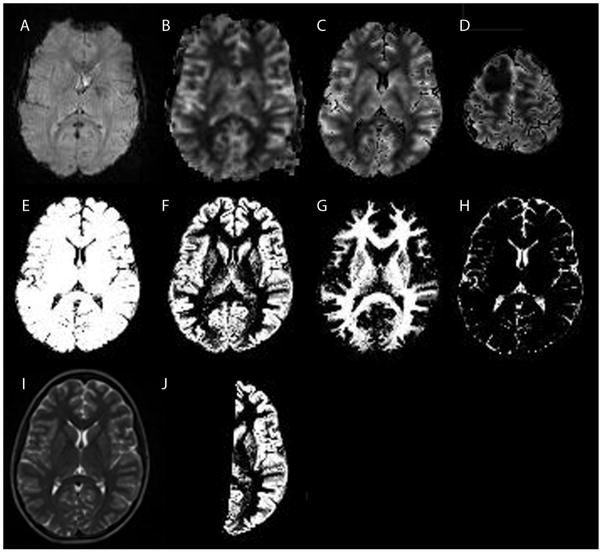
Figure 3.
Example DSC-MRI and segmentation data in a patient with a grade II right frontal astrocytoma. A: A raw data GRE-EPI image acquired at t=0 before contrast administration. B: Cerebral blood flow map generated from the raw data using standard singular value decomposition. The image was thresholded to exclude extracerebral tissues, while avoiding to exclude cerebral tissue. Some extracerebral tissue could not be removed with this simple threshold approach. C: Cerebral blood flow map after the brain mask (E) was applied. Extracerebral tissues are no longer included. This dataset was used to calculate total cerebral blood flow from the DSC-MRI data. D: Same as C, but more superior slice location showing the right frontal lesion. E: Brain mask generated from the brain segmentation, used to improve the removal of extracerebral tissues (C and D). F: Gray matter segmented image. G: White matter segmented image. H: CSF segmented image. I: T2 weighted image used as input to the segmentation algorithm. J: Gray matter brain mask of the hemisphere contralateral to the brain tumor. A similar mask was generated for the white matter (not shown). Hemispheric masks were used to calculate the regional tissue perfusion in normal appearing gray and white matter.

