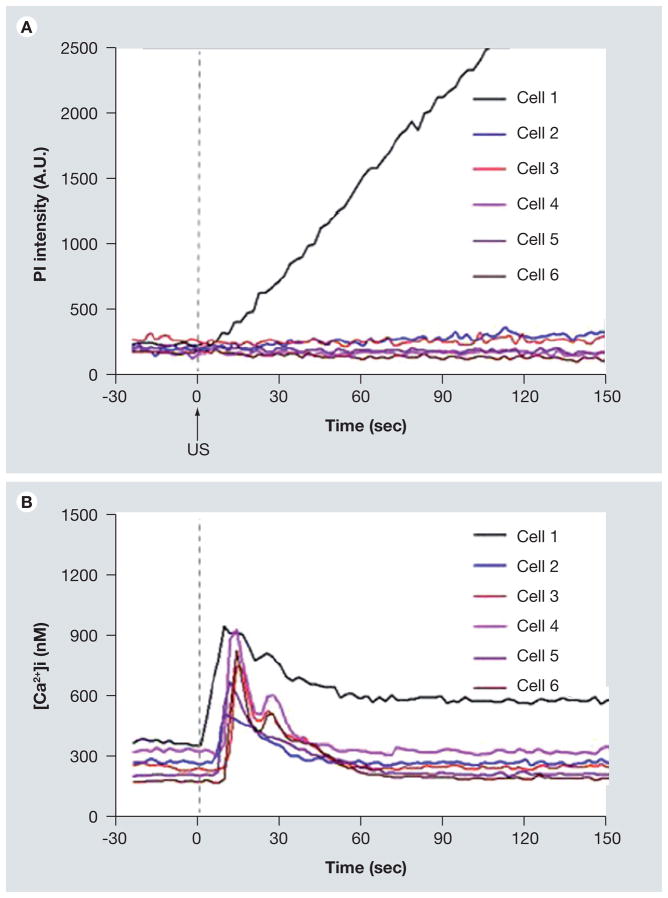
Figure 12. Propidium iodide (PI) fluorescence intensity and [Ca2+]i showing immediate and delayed changes of [Ca21]i in b.End3 cells.
(A) Mean PI fluorescence as a function of time for cells 1–6 where cell 1 had irreversible membrane disruption, (B) mean [Ca21]i as a function of time for cells 1–6, showing the immediate change in calcium (cell 1) and delayed calcium change (cells 2–6). The regions-of-interest for cell 1–6 are shown in Figure 11B.
Reproduced with permission from [126] © Elsevier.

