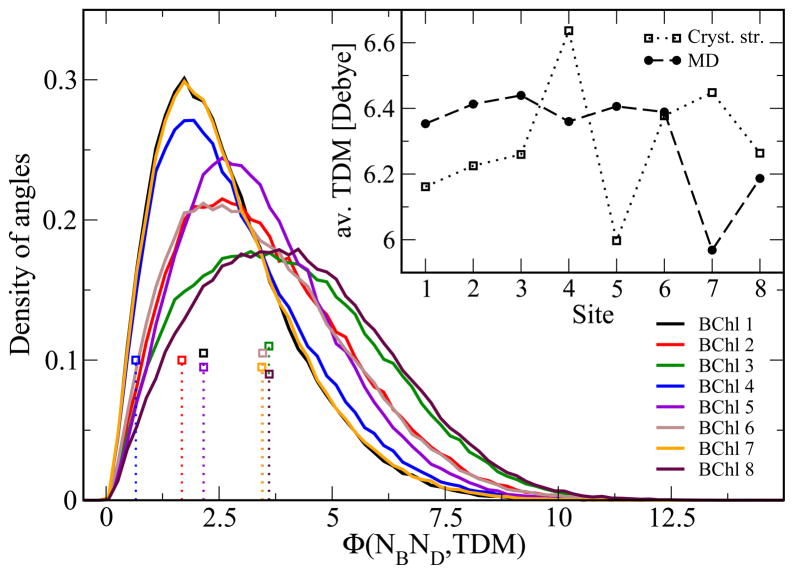
Figure 6.
Magnitude and angle distributions of the TDM. The inset shows the magnitude of the transition dipole moment averaged over the trimer trajectory and the three monomers as explained in the text. The main graph shows the corresponding distribution of angles (in degrees) between the TDM and the NB-ND axis of the individual BChls (solid lines) together with the values based on the crystal structure (doted sticks, open squares).

