
Figure 2.
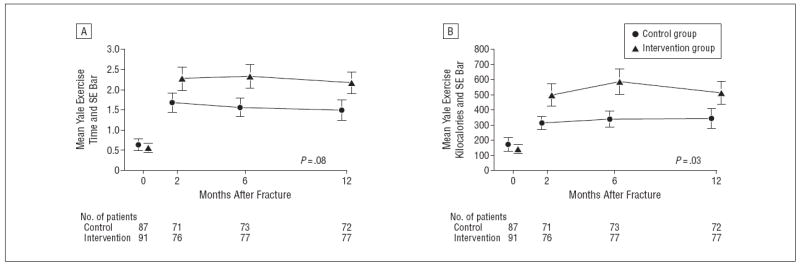
Yale exercise time in hours (A) and Yale exercise kilocalories (B) expended over time in the intervention and control groups. The P value indicated on the graph pertains to a test on the null hypothesis of no between-group difference in the 2- to 12-month trajectories.