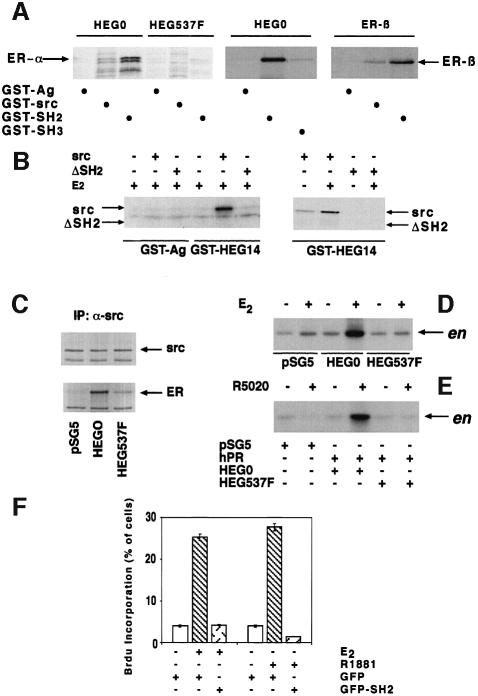
Fig. 7. Role of the Src SH2 domain in hER–Src association and signalling activation by steroids. (A) (Left) GST–agarose (GST-Ag), GST–Src and GST–SH2 were incubated in the presence of 10 nM oestradiol with either HEG0 or HEG537F labelled with [35S]methionine during their synthesis in reticulocyte lysate. (Middle) GST–Ag, GST–SH2 and GST–SH3 were incubated with [35S]HEG0 in the presence of 10 nM oestradiol. (Right) GST–Ag, GST–Src and GST–SH2 were incubated with [35S]hERβ in the presence of 10 nM oestradiol. Proteins were eluted with SDS, subjected to SDS–PAGE and revealed by autoradiography. (B) (Left) GST–Ag and GST–HEG14 (HEG14 is the C-terminal half of HEG0) were incubated in the presence of 10 nM oestradiol alone or together with either [35S]Src or [35S]Src lacking the SH2 domain (ΔSH2). (Right) GST–HEG14 was incubated in the absence or presence of 10 nM oestradiol with either Src or ΔSH2. Proteins were eluted with SDS, subjected to SDS–PAGE and revealed by fluorography. (C) Cos cells, transfected with either empty pSG5 vector or vector pSG5-HEG0 or pSG5-HEG537F, were treated with 10 nM oestradiol for 2 min. Cell lysates were immunoprecipitated with anti-Src antibody. The immunoprecipitates were blotted either with H222 anti-ER (lower) or anti-Src (upper) antibody. (D) Cells transfected as in (C) were incubated in the absence or presence of 10 nM oestradiol for 2 min. Immunoprecipitates by anti-Src antibody were assayed for Src activity using enolase (en) as substrate. (E) Cos cells were transfected with the empty pSG5 vector or PSG5-PR-B together with either PSG5-HEG0 or pSG5-HEG537F. Cells were stimulated for 2 min with 10 nM R5020 progestin. Src activity of the immunoprecipitates from cell lysates was assayed. (F) Quiescent LNCaP cells were injected with either GFP- or GFP-SH2-expressing plasmids. Cells were then left unstimulated or stimulated with either 10 nM oestradiol or R1881. BrdU was included in the cell medium and after 24 h DNA synthesis was analysed. It was calculated as in Figure 1C. Data from several coverslips were pooled and evaluated statistically. The means ± SEM are also shown.

An official website of the United States government
Here's how you know
Official websites use .gov
A
.gov website belongs to an official
government organization in the United States.
Secure .gov websites use HTTPS
A lock (
) or https:// means you've safely
connected to the .gov website. Share sensitive
information only on official, secure websites.
