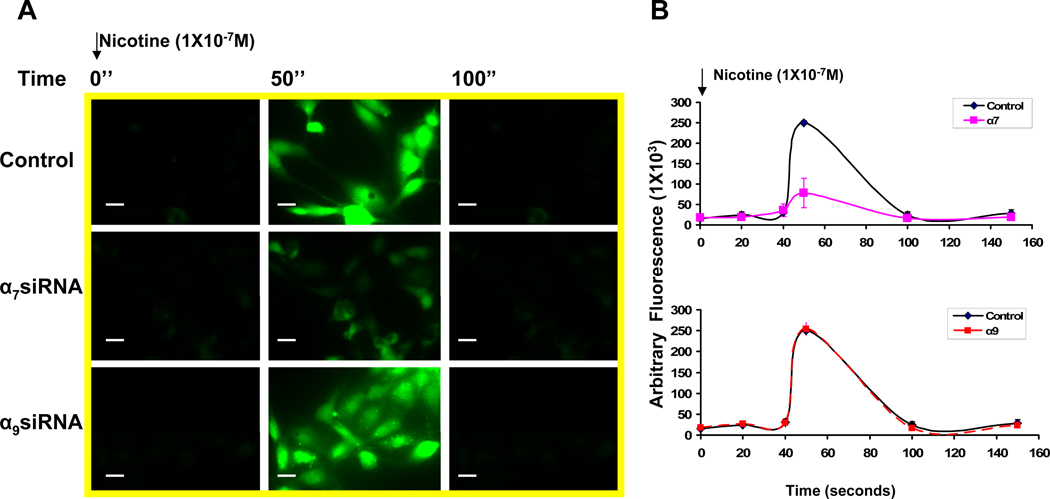
Figure 5. Nicotine increases intracellular Ca2+.
(A) Fluorescence photomicrograph of HMVEC cells loaded with fluo-4. Nicotine (10−7 M) elevated intracellular Ca2+ as indicated by increase in fluorescence emission intensity: left panels (before stimulation) middle panels (50 seconds after stimulation), and right panels (100 seconds after stimulation). Upper row: control cells; middle row: middle row: response of cells previously exposed to siRNA against α7 for 72 hours; bottom row: response of cells previously exposed to siRNA against α9 for 72 hours. A representative photomicrograph is shown. Bar, 10 um. (B) Time course of fluorescence emission intensity in HMVEC cells loaded with fluo-4. Cell were transfected and stimulated as described in (A). The values are expressed as arbitrary fluorescence intensity. The average of ten measurements (without baseline subtraction) in the assay were plotted.

