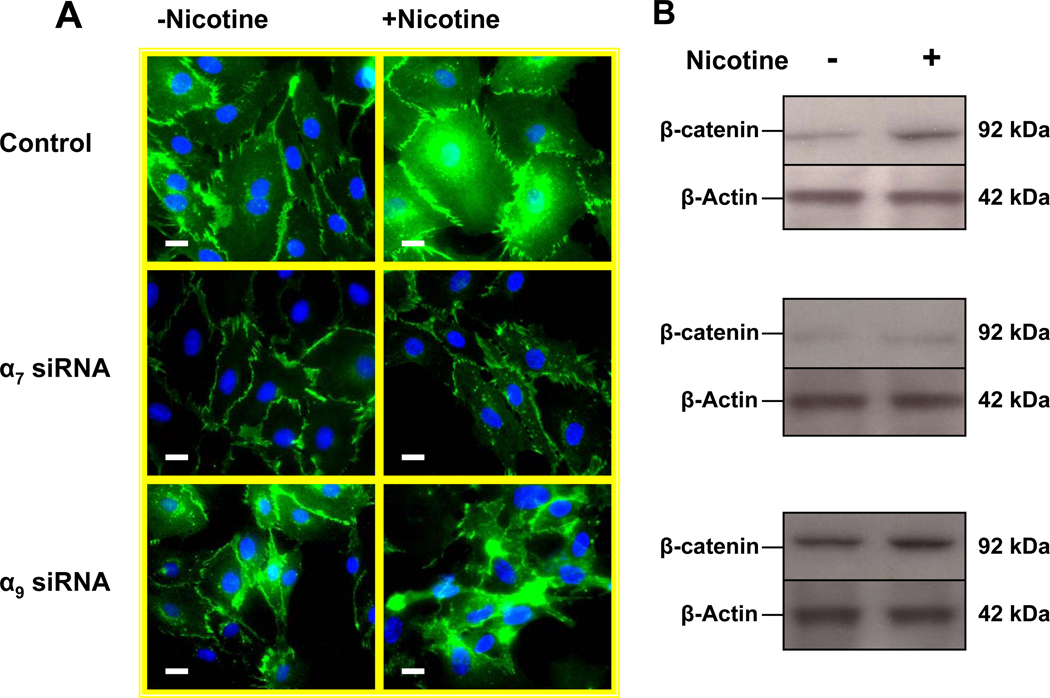
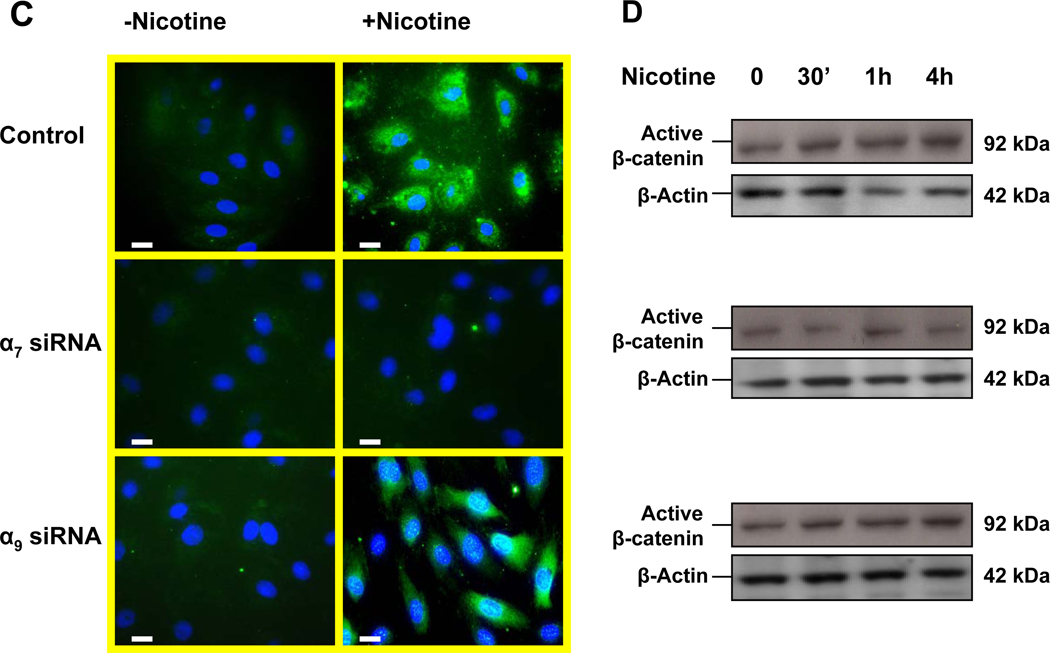
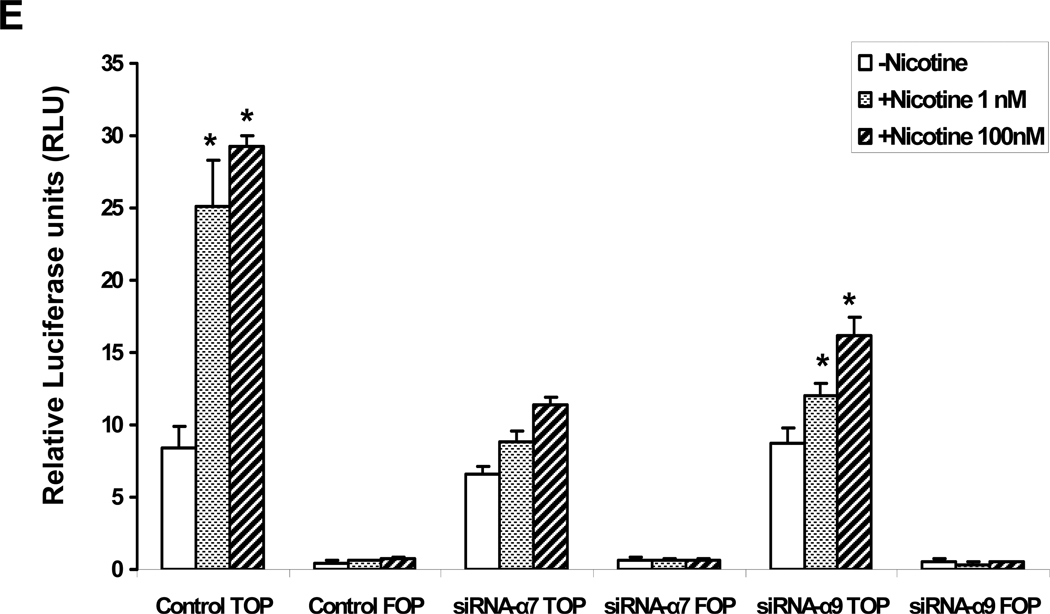
Figure 6. The α7 nAChR is necessary for nicotine-induced activation of β-catenin.
(A). In untreated HMVEC (upper left panel) β-catenin was immunolocalized to the membrane; HMVEC exposed to nicotine(10−8M) for 24 hours manifested an increase in β-catenin in the cytoplasm and nucleus (upper right panel); HMVEC were exposed to transfection vehicle (upper panels) or transfected with siRNA against α7 (middle panels) or α9 (bottom panels) for 72 hours and then exposed to vehicle (left panels) or to 10−8 M nicotine (right panels) for 24hours. Hoechst staining (blue) for nuclei, and FITC staining for β-catenin (green). Bar = 5 µm. (B) Representative Western immunoblots for β-catenin and β-Actin in response to nicotine stimulation for 24 hours in control cells, siRNA-α7 transfected cells, and siRNA-α9 transfected cells. (C) Active β-catenin accumulation in both nuclei and cytoplasm were observed by immunofluorescence 4 hours after stimulation by nicotine (10−8M) in control and siRNA-α9 transfected cells, but not siRNA-α7 transfected cells. (D) Immunoblotting for active β-catenin showed an increase which peaked 30 minutes after nicotine stimulation, an effect that was blocked by siRNA against α7 but not α9 nAChR gene expression. (E) Effect of nicotine on T-cell factor (TCF) activity. HMVEC were transfected, siRNA against α7 or α9 or with scrambled siRNA for 48 hours and subsequently transfected with TOPflash, a TCF-responsive firefly luciferase reporter plasmid for another 24 hours. Some cells were transfected with FOPflash, which contains mutant TCF binding sites, for use as a negative control. Cells were also transfected with pRL-TK, a Renilla luciferase plasmid which was used for normalization of transfection efficiency. Luciferase activity was analyzed 4 hours after addition of nicotine to the cells. Values are TOPflash RLUs from 3 different experiments. Error bars represent mean ±SEM, * p< 0.05 vs. unstimulated control.


