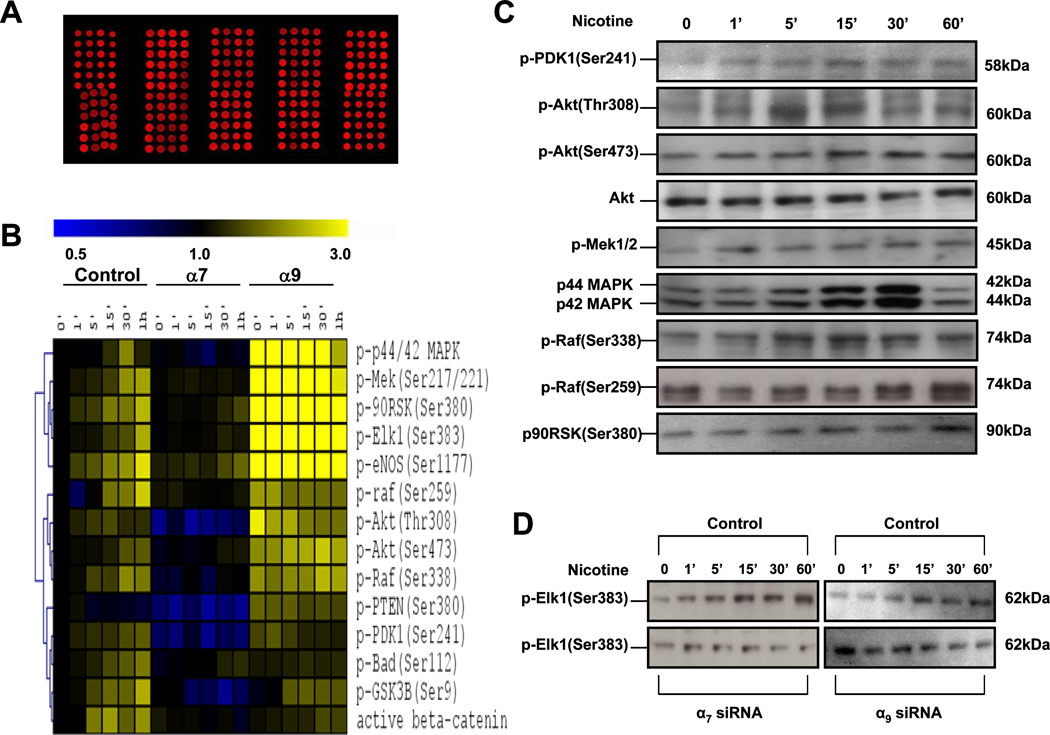
Figure 7. Reverse phase protein (RPP) microarray profiling of nicotine stimulated ECs.
(A) Lysates derived from control cells or cells pretreated with siRNA against each nAChR subunit were quantified by protein amount and printed on nitrocellulose-coated slides in 3 triplicates. Fluorescent image of a representative RPP microarray probed with a primary antibody specific for the phospho-c-Raf is shown. Each 4 × 12 subarray contains lysates derived from a single nAChR knockdown subunit. Each feature on the array is approximately 400 µm in diameter. (B) Hierarchical cluster analysis of phosphorylation protein kinetics effects of nicotine in HMVECs. The first seven columns display data from control lysates from HMVECs. The middle seven columns display data from HMVECs in which the α7 subunit was knocked down and the last set of seven columns display data in which α9 receptor was knocked down. Within each set of columns, there is a time course from 0 to 60 minutes. Yellow denotes increased staining and blue denotes decreased staining compared to the control HMVEC lysate at the 0 time point. The intensity of the color reflects the magnitude of the change from baseline. The dendrogram on the left of matrix represents similarities in patterns of activity among phosphoproteins. (C)–(D) Corresponding immunoblots for the phosphoproteins in the microarray.

