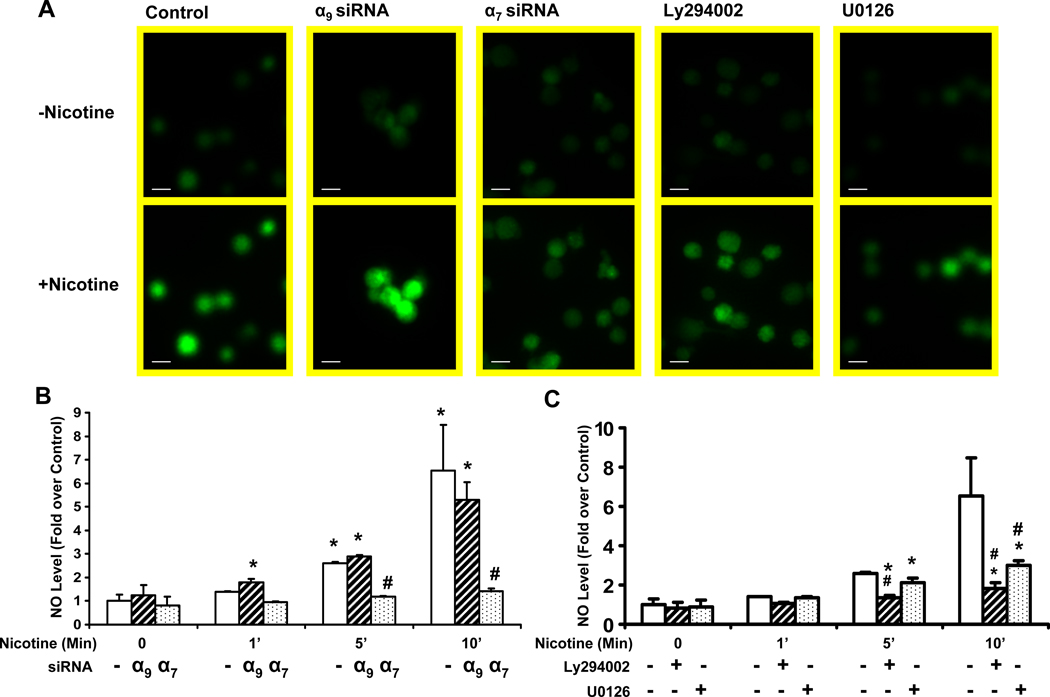
Figure 8. Nicotine increases NO production.
(A) HMVECs were loaded with DAF-FM DA (20 µM) as described in Material and Methods. Increasing fluorescence intensity reflects NO synthesis. Representative results are shown. Upper panels show basal fluorescence intensity before stimulation. Bottom panels show fluorescence 15 minutes after nicotine(10−7 M) stimulation. From left to right: panel1: Control cells, treated with transfection vehicle for 72 hrs prior to nicotine stimulation; panel2 :cells treated with siRNA against α9 preceding the nicotine stimulation. panel3: cells pretreated with siRNA against α7 prior to nicotine stimulation. panel4: cells pretreated with PI3 kinase inhibitor Ly294003 (50 uM) for 1 hour followed by nicotine stimulation. panel5: cells pretreated with U0126 (20 uM) for 1 hour followed by nicotine stimulation. Bar = 20 µm. (B)–(C) Measurement of the intracellular NO level. The average intensities in the ECs relative to the control group were evaluated as described in materials and methods. n=10, *p<0.05 versus control (non-transfected) cells at time 0. # p<0.05, vs. non-transfected cells exposed to same stimulus duration.

