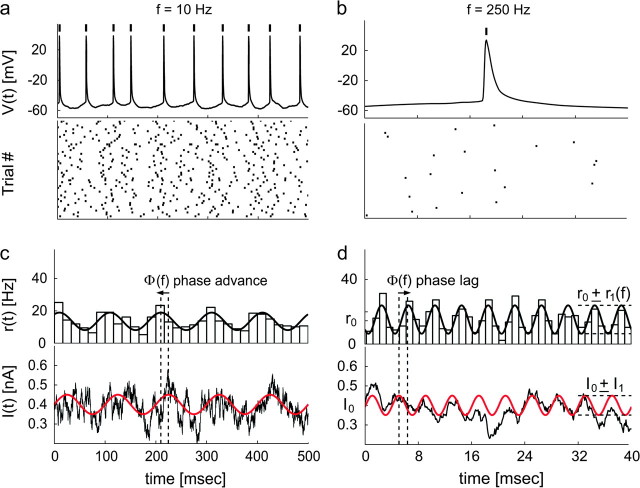
Figure 2.
Analyzing the discharge response to the oscillatory input signal over a background of irregular synaptic inputs. Irregular spike trains were evoked in the same neuron by sinusoidally modulated noisy current injections. The time of occurrence of each action potential (a, b) was referred to its peak and represented by a thick vertical mark. Lower panels show the spike raster-plots collected for different input modulation frequencies, f = 10 Hz and f = 250 Hz. The instantaneous firing rate r(t) (c, d—upper panels) reveals a sinusoidal modulation in time. This was estimated by the peristimulus time histograms (PSTHs) (bars) across repeated trials and successive input cycles, and quantified by the best-fit sinusoid with frequency f (black thick line). For the sake of comparison, the sinusoidal component of I(t) (c, d—lower panels) was plotted in red and superimposed to the actual injected waveform. Although the mean firing rate r0 remains constant, its modulation r1 and phase-shift Φ depend on the input frequency f.

