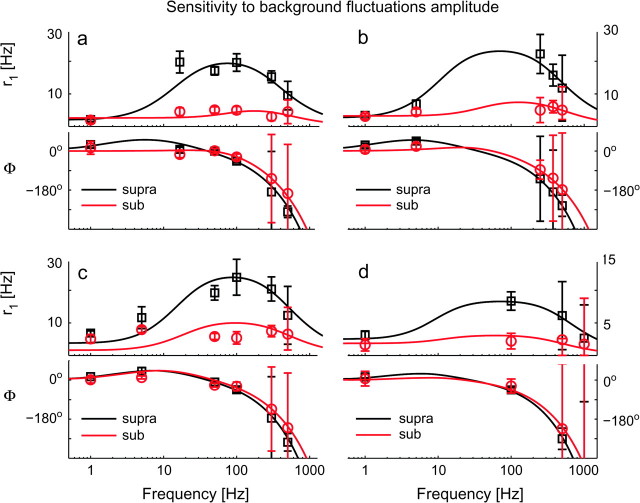
Figure 5.
The intensity of background fluctuations affects the dynamical response of cortical neurons. The impact of the noise variance s2 was examined across a wide range of input frequencies f, in 4 distinct cells (a–d), under the same conditions of Figure 3. Strong background noise smoothes r1(f) at intermediate frequencies, as in a programmable equalizer. Linear instead of logarithmic scale has been employed here for the y-axis. Each subpanel (top to bottom) reports r1(f) and Φ(f), identifying the suprathreshold or weak-noise regime (“supra”—black markers) and the subthreshold or strong-noise regime (“sub”—red markers) by different marker shapes and colors. Each regime is characterized by distinct values for I0 and s2, adapted to yield a similar mean rate r0 ∼ 20 Hz. Experimental data points (markers) have been plotted together with the best-fit predictions from a phenomenological filter model (continuous traces). For these cells, band-pass 2nd-order filters (i.e., n = 2—eq. 6) were found to describe the experimental data with high significance (see Supplemental Table S1). Error bars represent the 95% confidence intervals, obtained by the Levenberg–Marquardt fit algorithm. High-frequency error bars were large because of the poor signal-to-noise ration as well as for the ambiguity of the (periodic) estimates of Φ(f). Although I1 = 50 pA and τ = 5 ms were fixed for all cells and both regimes, the remaining stimulation parameters were: (suprathreshold) (I0, s)a = (500, 50), (I0, s)b = (400, 20), (I0, s)c = (250, 25) and (I0, s)d = (350, 50) pA; (subthreshold) (I0, s)a = (300, 400), (I0, s)b = (150, 325), (I0, s)c = (100, 250) and (I0, s)d = (100, 450) pA.

