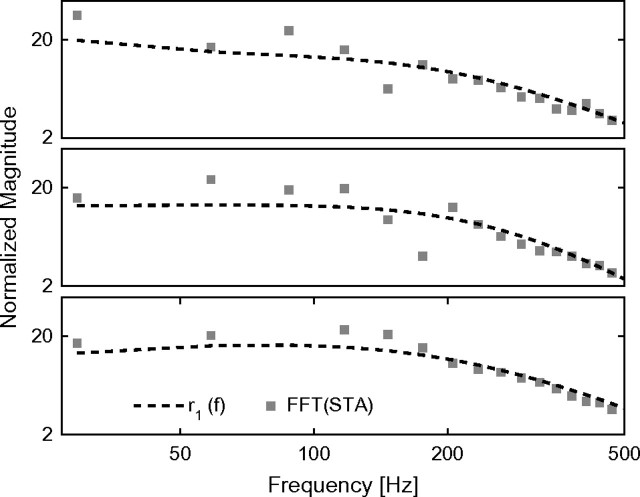
Figure 8.
Comparison between the 1st-order kernels computed by reverse-correlation techniques and the best-fit frequency response of the linear filter model of Figure 7. The modulation amplitude r1(f) (dashed line, identifying eq. 6) was compared with the fast Fourier transform (FFT) of the STA (markers) of the input current preceding a spike. The last was evaluated correlating the signal component iT(t) with the timing of each action potential, in 3 experiments. As expected from interpreting the STA as the 1st-order kernel, striking similarities are apparent.

