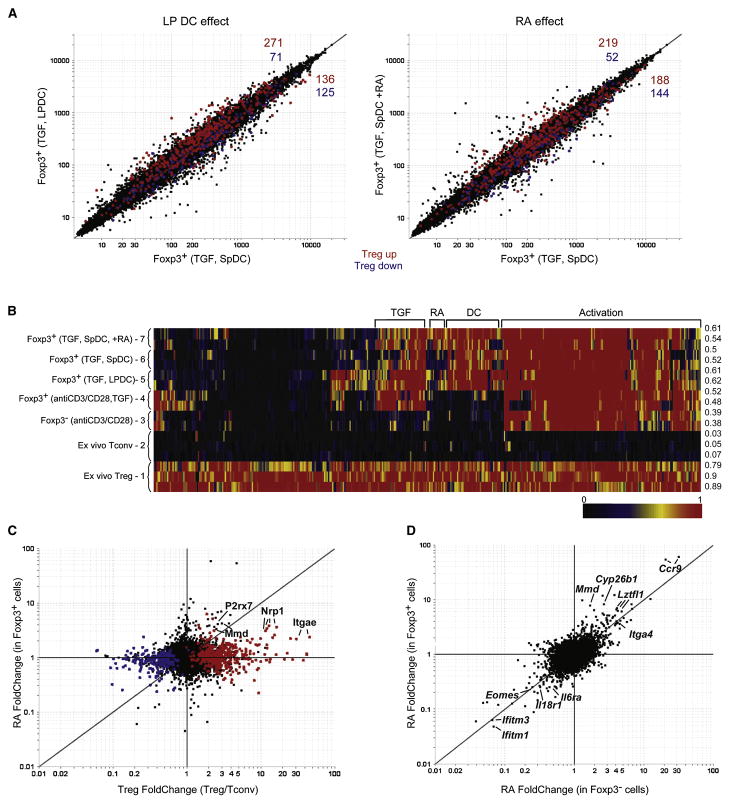
Fig. 2. Retinoic acid influences the expression of a discrete group of genes that are largely independent of the canonical Treg cell genomic signature.
A) Comparison of probe expression values in Foxp3+ T cells after culture with anti-CD3, TGFβ and: lamina propria DCs (y-axis) or spleen DCs (x-axis), left pannel; or spleen DCs with (y-axis) or without (x-axis) retinoic acid (100 nM), right pannel. Probes highlighted in red and blue correspond to genes either up or down-regulated (respectively) in the canonical Treg cell genomic signature. B) “Signature Match” Heat map analysis of the Treg cell genomic signature in ex vivo Treg cells or TGFβ converted cells (Foxp3+, anti-CD3/CD28, TGF, and Foxp3-, anti-CD3/CD28 are from (Hill et al., 2007)). Raw expression values were normalized to 1 or zero for ex vivo Treg cells or Tcov cells respectively. The expression values for genes from the TGFβ converted cells were normalized within this range (for a detailed description of the algorithm see supplemental experimental procedures) and displayed as a heat map where red represents the expression of a gene at the same or a greater level than what is found in an ex vivo Treg cell, while black is the expression of a gene that is at the same or lower level than an ex vivo Tconv cell. Numbers to the right of the diagram show the average score for each group across the entire signature. C) FcFc plot comparing the effects of retinoic acid in Foxp3+ TGFβ converted cells (y-axis) with ex vivo Treg cells (x-axis). D) FcFc plot comparing the effects of retinoic acid in Foxp3+ (y-axis) and Foxp3-(x-axis) TGFβ treated cells.

