
Fig. 2.
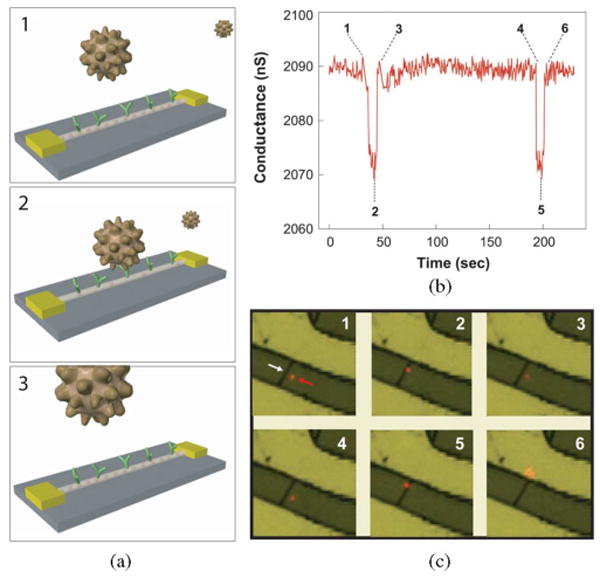
(a) Schematic illustration of a single virus binding and unbinding to the surface of an NWFET modified with antibody receptors. (b) Conductance versus time data recorded from a single device modified with antiinfluenza type A antibody. (c) Optical data recorded simultaneously with conductance data in (b). Combined bright-field and fluorescence images correspond to time points 1–6 indicated in the conductance data; virus appears as a red dot in the images. The white arrow in image 1 highlights the position of the NW, and the red arrow indicates the position of a single virus. Images are 8 × 8 μm. Adapted from [35] (National Academy of Sciences, copyright 2004).