
Fig. 7.
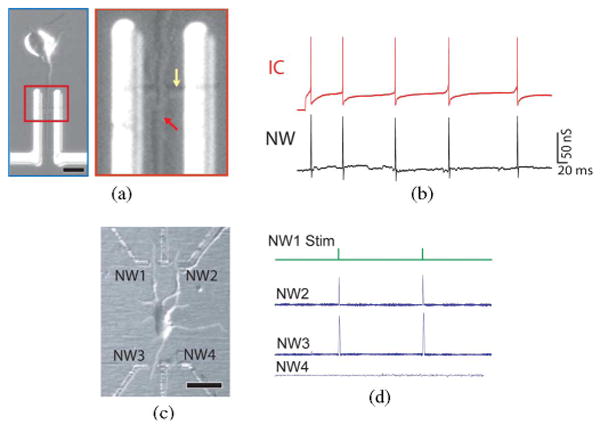
(a) Optical image of a cortical neuron aligned across an NWFET; scale bar is 10 μm. Inset: High-resolution image of region where (red arrow) axon crosses (yellow arrow) an NW. (b, red trace) IC potential of an aligned cortex neuron (after 6 days in culture) during stimulation with a 500-ms-long current injection step of 0.1 nA; (b, black trace) time-correlated signal from axon measured using a p-type NWFET. (c) Optical image of a cortical neuron interfaced to three of the four functional NWFETs in an array; scale bar is 20 μm. (d) Trace of pulses applied to NW1 for antidromic stimulation of the neuron. The response was measured by the NW–dendrite junctions at NW2 and NW3. Adapted from [58] (American Association for the Advancement of Science, copyright 2006).