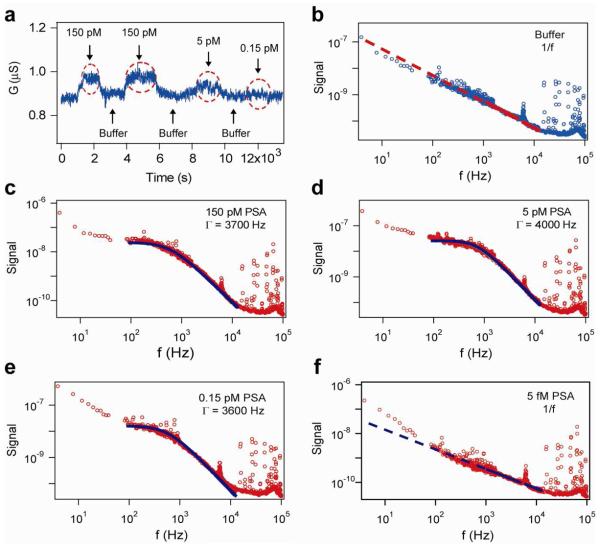
Figure 2.
(a) Time domain conductance measurement of a p-type SiNW FET sensor modified with PSA monoclonal antibodies, when different concentrations of PSA solutions (as shown) and pure buffer were sequentially delivered to the sensor. Red dashed circles indicate the time windows of PSA binding on the NW surface. (b) Power spectrum of the same SiNW FET sensor in buffer shows a 1/f frequency dependence. The data are blue circles and the 1/f dependence is shown as the red dashed line. (c-e) Power spectra recorded in solutions with different PSA concentrations, 150, 5, 0.15 pM, show Lorentzian shape curves, with characteristic frequencies (Γ) of 3700, 4000, and 3600 Hz, respectively. (f) Power spectrum recorded in 5 fM PSA solution shows a 1/f frequency dependence. The y-axis unit for Figs. (b-f) is V2/Hz. Data in (c-f) are red circles and fits are black dashed lines.

