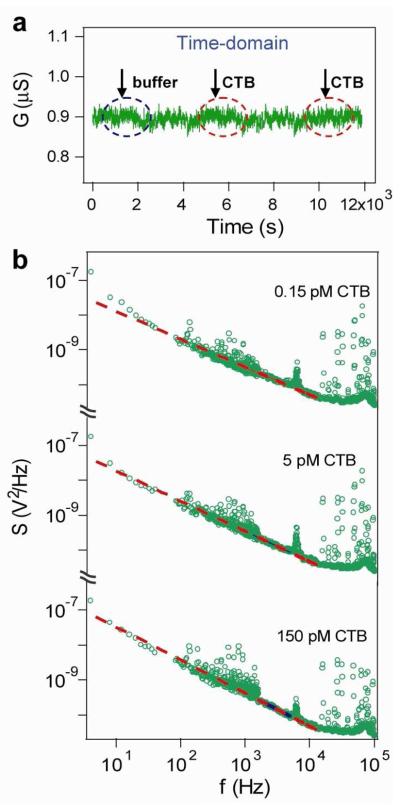
Figure 3.
(a) Real-time conductance measurement of a p-type SiNW FET sensor modified with monoclonal antibodies to PSA, while different concentrations of CTB solutions and pure buffer were sequentially delivered onto the sensor surface. Black and red dashed circles indicate the time windows when buffer or CTB solutions were delivered onto the NW surface. (b) The power spectra of the same SiNW FET sensor in solutions with different CTB concentrations, 0.15, 5, 150 pM, respectively, show curves of 1/f shape. The data are green circles and fits are red dashed lines.

