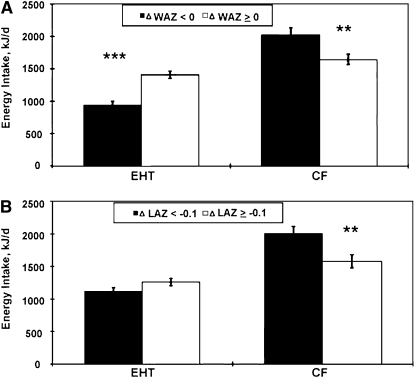
FIGURE 3 .
Differences in energy intakes from EHT milk and complementary foods (CF) between children whose ponderal (A) and linear (B) growth did (ΔWAZ < 0, n = 10; ΔLAZ < −0.1, n = 10) and did not falter (ΔWAZ ≥0, n = 10; ΔLAZ ≥−0.1, n = 10) between recruitment and the final visit. Bars represent means ± SE. Asterisks indicate that means differed: ** P < 0.01; *** P < 0.001.

