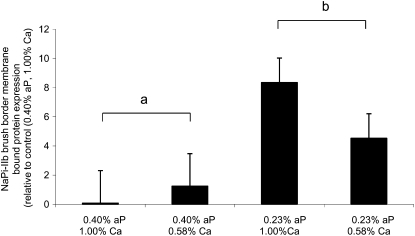
FIGURE 3 .
Jejunal NaPi-IIb protein expression in weanling pigs fed various concentrations of dietary aP and Ca. Values are means ± SE, n = 4 for 0.40% P, 1.00% Ca and 0.40% P, 0.58% Ca; n = 7 for 0.23% P, 1.00% Ca and 0.23% P, 0.58% Ca. Means without a common letter differ, P < 0.01, for the main effect of dietary aP level.

