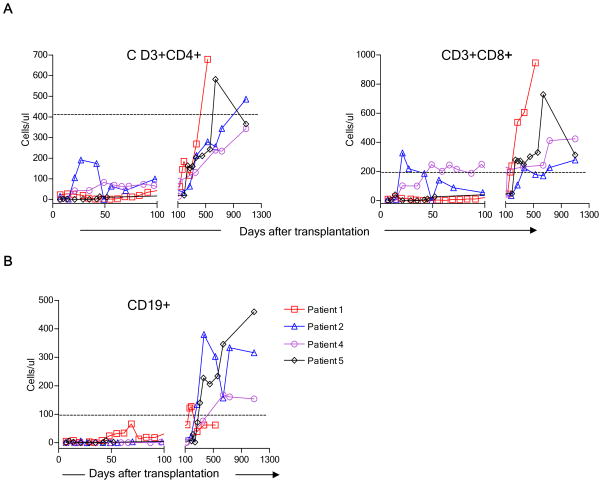
Figure 1.
Time course of T and B cell recovery in four patients following non-myeloablative conditioning. (A) CD3+CD4+, CD3+CD8+ and (B) CD19+ recovery. Peripheral blood concentrations of each cell type in fresh blood samples are shown at the indicated time point. The horizontal dotted lines denote the 10th percentile for normal adults.

