Figure 2.
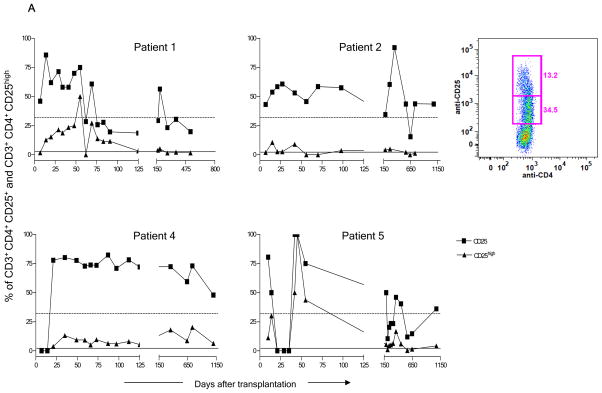
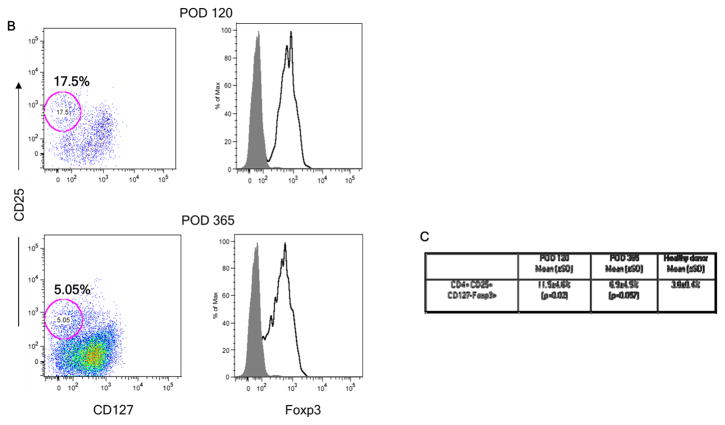
Enrichment of CD4+CD25+ cells after transplant. (A) Recovery of CD25+ and CD25high cells in fresh blood samples in each of the four patients among total gated CD3+CD4+ T cells. Dotted and solid lines, respectively, denote the median value of CD4+CD25+ and of CD4+CD25high cells found in normal controls. The inset panel shows CD25low and CD25high populations in a representative sample from Patient 5. (B) Expression of FoxP3 (right panel), open histograms. Shaded histograms represent unstained controls on gated cryopreserved/thawed CD4+CD25+CD127− cells (left panel), at POD 120 and 365. Plots from Patient 5 are representative of results from all 4 patients. (C) Percentages of CD25+CD127−FOXP3+ cells among gated cryopreserved/thawed CD4+ cells in patients’ peripheral blood at POD 120 and 1 year compared to healthy donors (HD) (n=4 patients at POD 120 and n=3 at 1 year and 5 normal controls).


