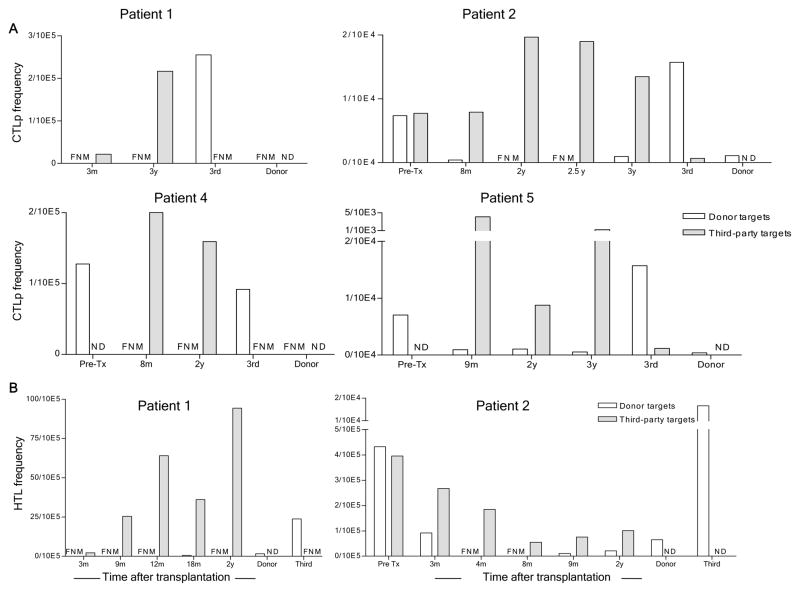
Figure 6.
CTL precursor and IL-2-producing cell frequencies as detected by limiting dilution assays against donor and third party PBMC stimulators and targets at various time points after transplant. (A) Summary of CTL precursor frequencies as calculated with the Poisson distribution. Responders and time points are indicated on the x axes. Stimulators and targets were donor and third party PBMC; (B) Frequencies of anti-donor IL-2-producing cells (helper T lymphocyte, HTL) in Patients 1 and 2 at the indicated time points, as calculated by Poisson distribution from IL-2 production measured in supernatants from limiting dilution cultures of patient and control PBMC stimulated with donor or 3rd party PBMC. FNM (Frequency not measurable), ND (Not Done)

