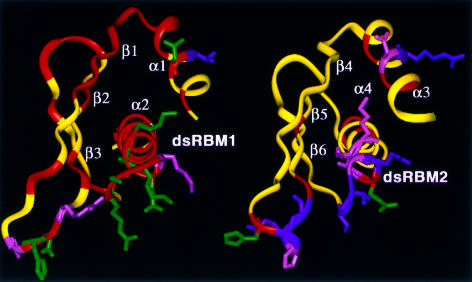
Fig. 4. Three-dimensional distribution of residues with Rex (red) in dsRBM1 and dsRBM2. The side-chains of the dsRNA binding residues from regions 1–3 are displayed. The residues with Rex or exchange broadening are displayed in green; the residues without Rex are displayed in magenta; and the residues unanalyzed due to spectral overlap are displayed in pink. Notice that regions surrounding the RNA binding site of dsRBM1 are covered by residues with Rex. A network of interactions extends the exchange effects from the dsRNA binding site to the surrounding regions such as the central hydrophobic core involving residues from α1, β1, β2 and α2.

An official website of the United States government
Here's how you know
Official websites use .gov
A
.gov website belongs to an official
government organization in the United States.
Secure .gov websites use HTTPS
A lock (
) or https:// means you've safely
connected to the .gov website. Share sensitive
information only on official, secure websites.
