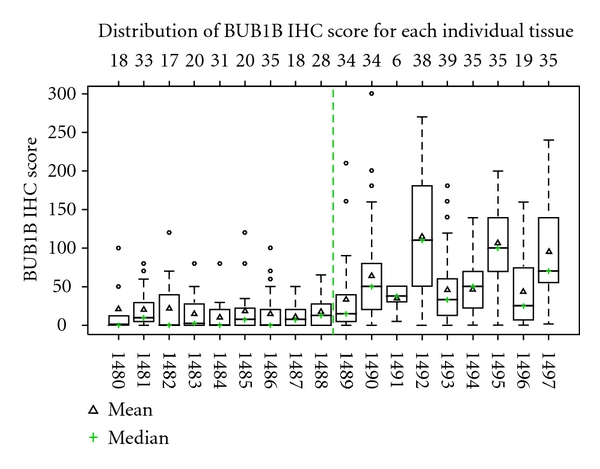
Figure 5.

Whisker plot showing BUB1B protein expression scores for each individual histologically normal breast tissue with high-grade (N = 9) and low-grade molecular abnormality (N = 9) analyzed. The median BUB1B IHC score for each specimen is represented by horizontal lines and symbol +, while mean BUB1B IHC score is represented by Δ. Both mean and median expression scores for the HNB tissues with high-grade molecular abnormality on microarray (cases 1489–1497) are higher than those for the molecularly low-risk HNB tissues with low-grade abnormality on microarray (cases 1480–1488). Overall, there is a greater variation in the expression scores for the HNB tissues with high-grade molecular abnormality as compared to those with low-grade molecular abnormality (SD = 48.4 versus 24.8; P = .003). The top row reflects the number of TDLUs that were evaluated for IHC expression of BUB1B protein in the respective stained section, representing each histologically normal breast tissue specimen.
