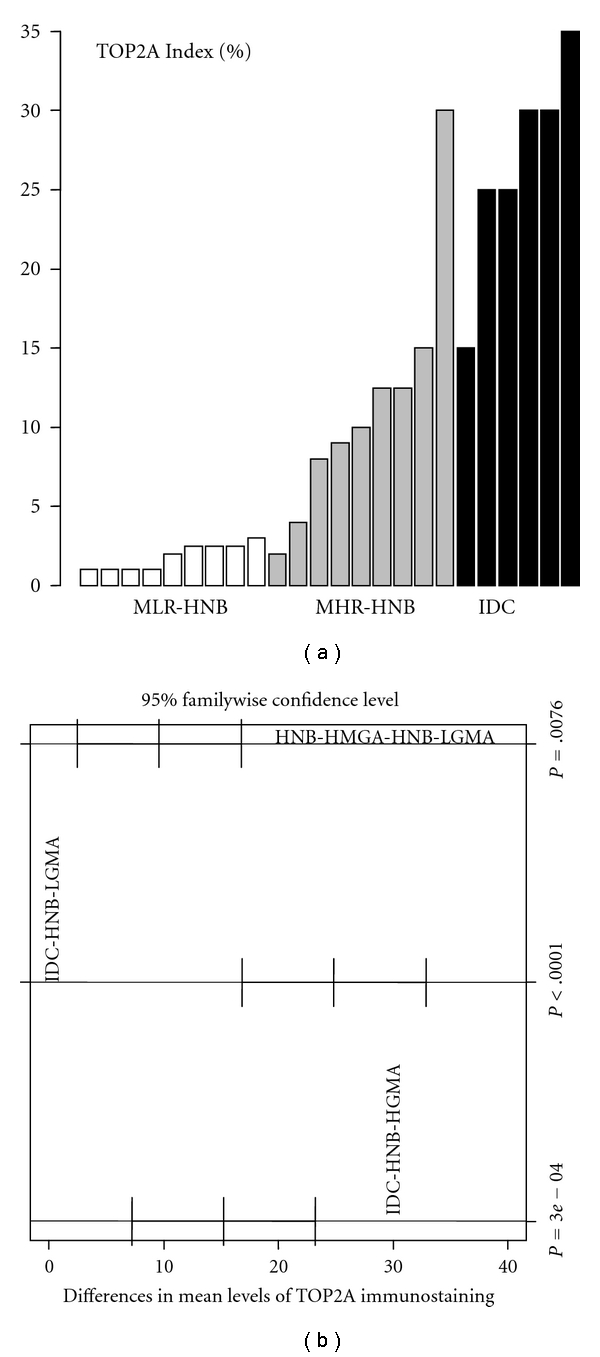
Figure 6.

Immunohistochemical expresssion of TOP2A protein in HNB tissues with low-grade and high-grade molecular abnormalities and in IDCs. There is an obvious trend toward increasing expression from HNB tissues with low-grade molecular abnormality (white bars) to those with high-grade molecular abnormality (gray bars), and the IDCs (black bars), thus providing evidence for cross-platform validation of our original expression profiling data for TOP2A at the protein level. (a) Is the specimen-wise distribution of immunohistochemical expression of TOP2A for the HNB tissues with low-grade and high-grade molecular abnormality and IDC groups. (b) is the pairwise comparison of TOP2A immunostaining among the three groups. For each comparison (e.g., IDC versus normal), a mean difference with a 95% confidence interval (95% CI) is displayed to examine whether the difference is statistically significant (A 95% CI deviated away from 0 is statistically significant). The adjusted P value for each comparison, based on Tukey method, is shown.
