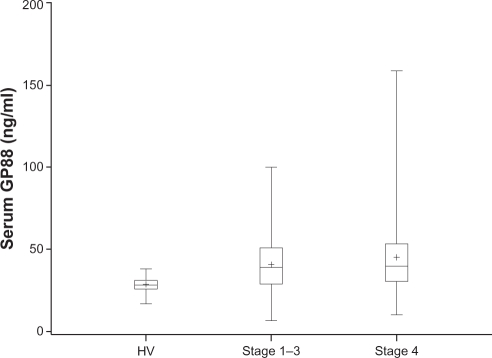
Figure 1.
Comparison of the GP88 level in healthy volunteers (HV) and breast cancer patients separated by stages (Stage 1–3) and stage 4. GP88 serum levels in healthy volunteers and breast cancer patients stage 1–3 and stage 4 were represented by box and whisker plots. The mean is represented by a + sign. The median is represented by the line inside the box. The bottom and top of the box represent the 25th and 75th percentiles. The vertical line extends to the minimum and maximum data values.

