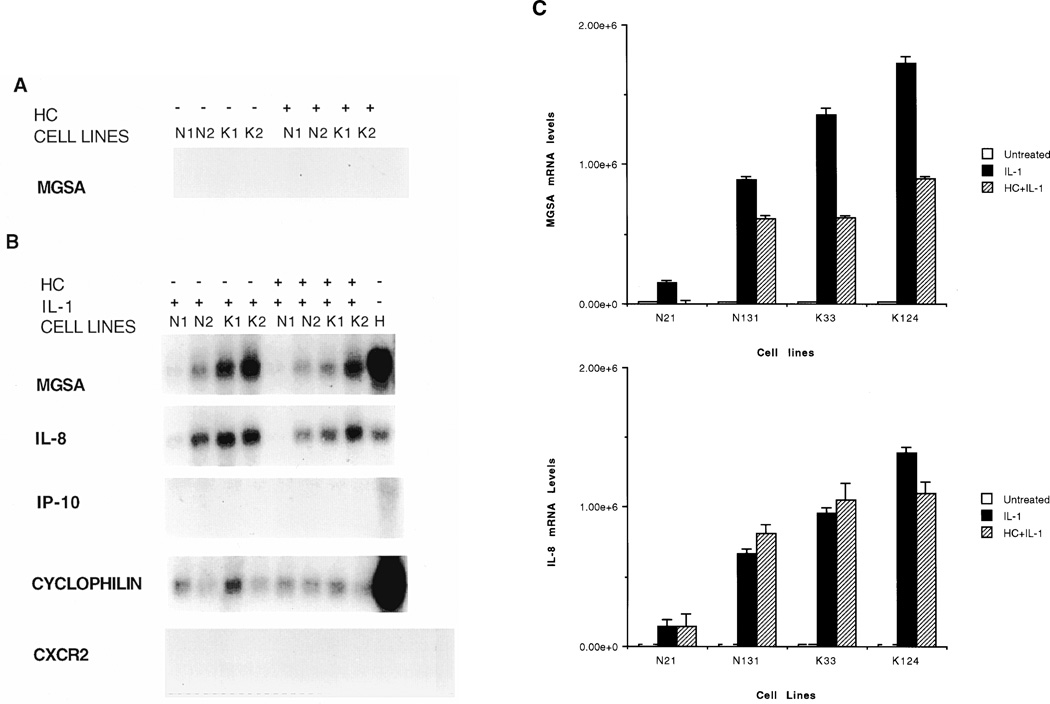
Figure 3.
Northern blot analysis of chemokine gene expression. Total RNA from two normal fibroblast cell-lines, N1 & N2, and two keloid fibroblast cell-lines, K1 & K2, was resolved on formaldehyde-agarose gels, transferred to nitrocellulose membranes and probed with 32P labeled probes as indicated on the left. (A) Cells were treated with hydrocortisone (HC) or left untreated. (B) Cells, either pretreated with HC or left untreated, received a 3-h IL-1 treatment prior to harvesting. Total RNA from Hs294T malignant melanoma cells (H) was used as a positive control. (C) Autoradiograms of MGSA/GRO, cyclophilin B and IL-8 northern blots were densitometrically scanned using the ImageQuant software (Molecular Dynamics). Values obtained for MGSA/GRO and IL-8 mRNA were normalized against values of cyclophilin B mRNA and the results represented graphically for levels of MGSA/GRO mRNA (top) and IL-8 mRNA (bottom). The Y-axis represents a ratio of MGSA/GRO mRNA levels (top) or IL-8 mRNA levels (bottom) to cyclophilin B mRNA levels. Each graph is based on three experiments. Error bars represent standard deviations.

