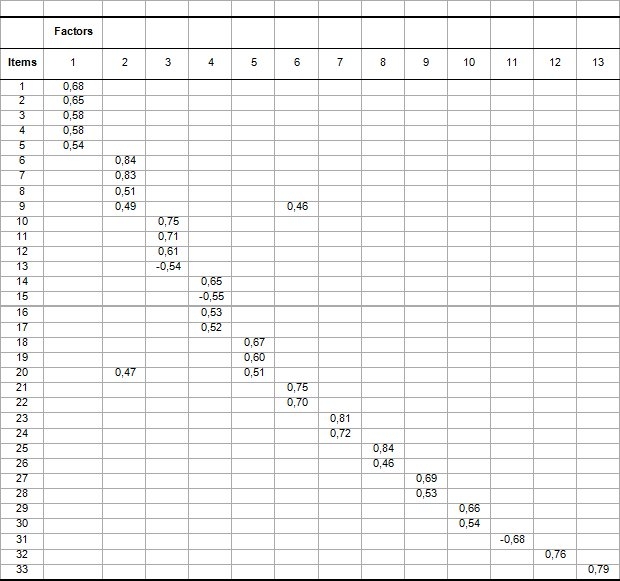
Table 3. Representation of the component matrix after extraction of the 13 themes (factor analysis). The values correspond to the factor loadings (Pearson r correlation coefficient), correlations <0.45 are not displayed. For the description of the items (rows) and the interpretation of the factors (columns) see Table 2.

