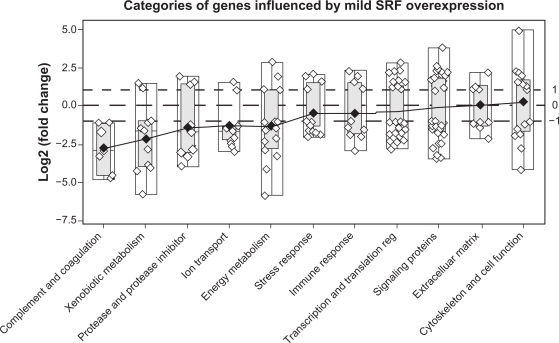
Figure 3.
A box-plot of the magnitude of change in gene expression (log2) in the Mild-SRF transgenic mice distributed among 12 different categories (category of “other proteins” not shown). Each gene is represented by a small circle. White boxes depict the range limits, and the light gray boxes, the inter-quartile range. The diamonds represent the means and are joined by a solid line. The categories are displayed from the most down-regulated (on the left) to the most up-regulated (on the right). Note that in the cytoskeletal category more genes are upregulated than downregulated.

