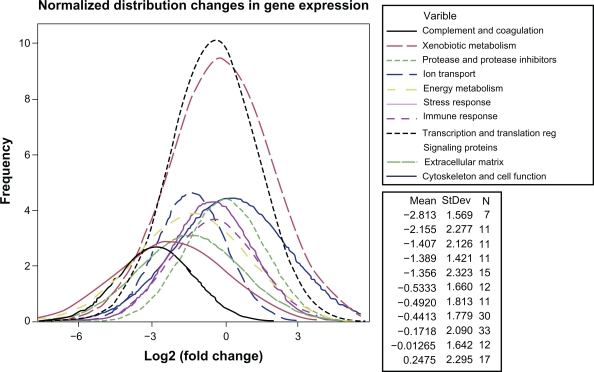
Figure 4.
Normalized distribution curves of SRF-modulated genes in response to mild-SRF overexpression in vivo. The legend at the top right shows the functional categories as variables. The legend at the bottom right, shows the mean fold change in gene expression, the standard deviation (SD) and the number (N) of genes in each category.

