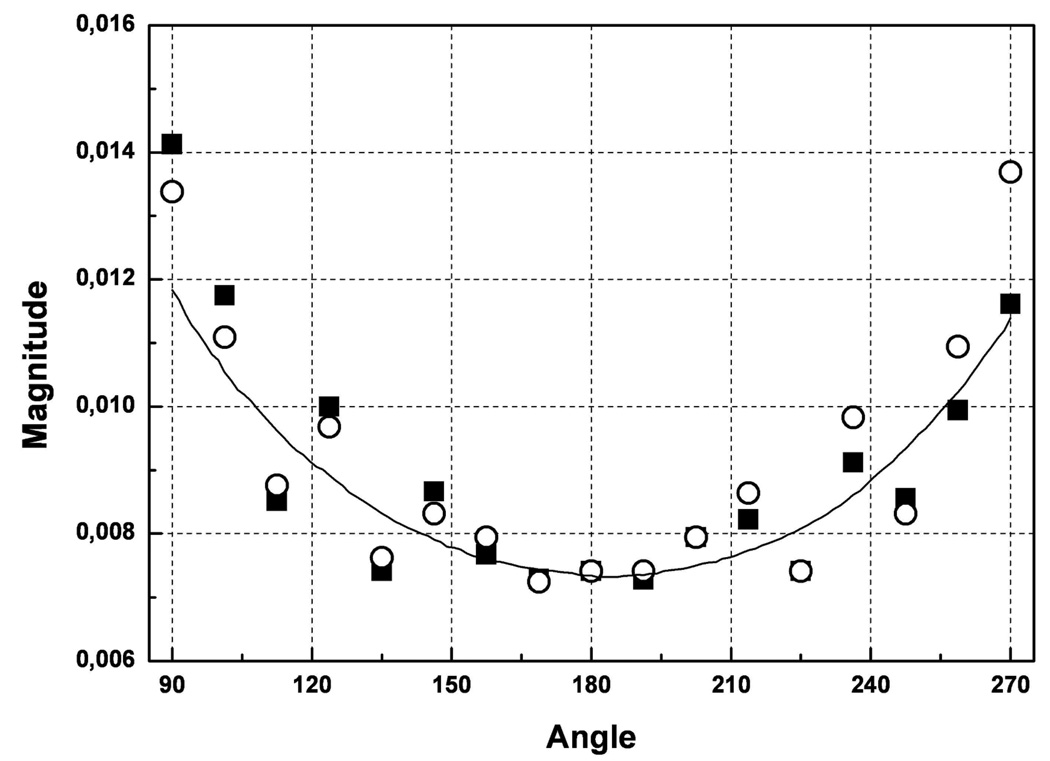
Figure 3.
A comparison of measured EM field distribution within a tomographic imaging chamber for two cases: symbols – when a measurement domain is within a metallic cylinder with “antenna windows” simulating a small metallic imaging chamber (case 1), line - the field without boundary restrictions within a measurement domain (case 2). Two symbol styles represent two independent measurements. See text for details. Frequency 2.05GHz. ε = 79+j9.

