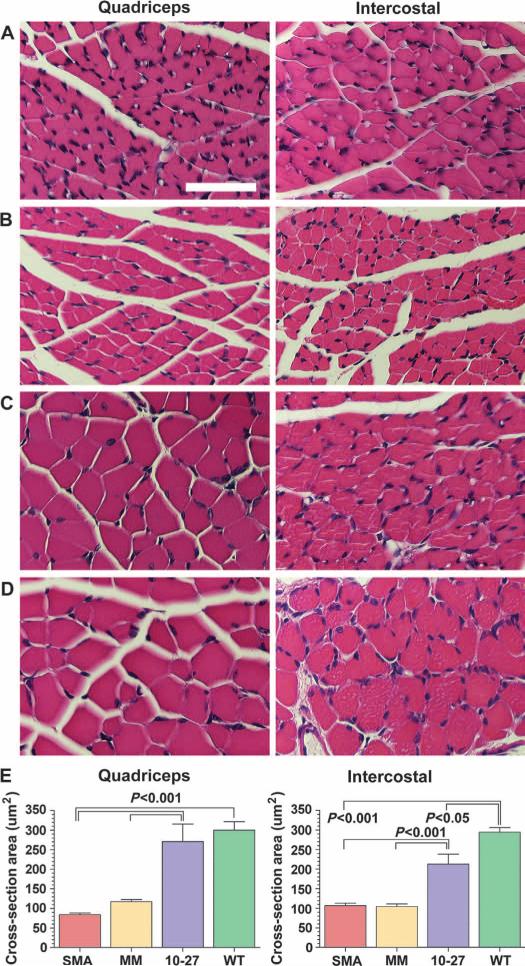
Fig. 3.
ASO-10-27 treatment increases myofiber size in SMA mice. (A to D) H&E staining of the quadriceps (left column) and intercostal (right column) muscles of untreated SMA mice (A), ASO-mismatch–treated SMA mice (B), ASO-10-27–treated SMA mice (C), and untreated WT mice (D) at 16 days. (E) The average myofiber cross-sectional area for each group was quantified. The P values between the different treatment groups were determined by one-way ANOVA and Bonferroni multiple post hoc comparisons (P < 0.05; P < 0.001). Data are means ± SEM. Scale bar, 50 μm.

