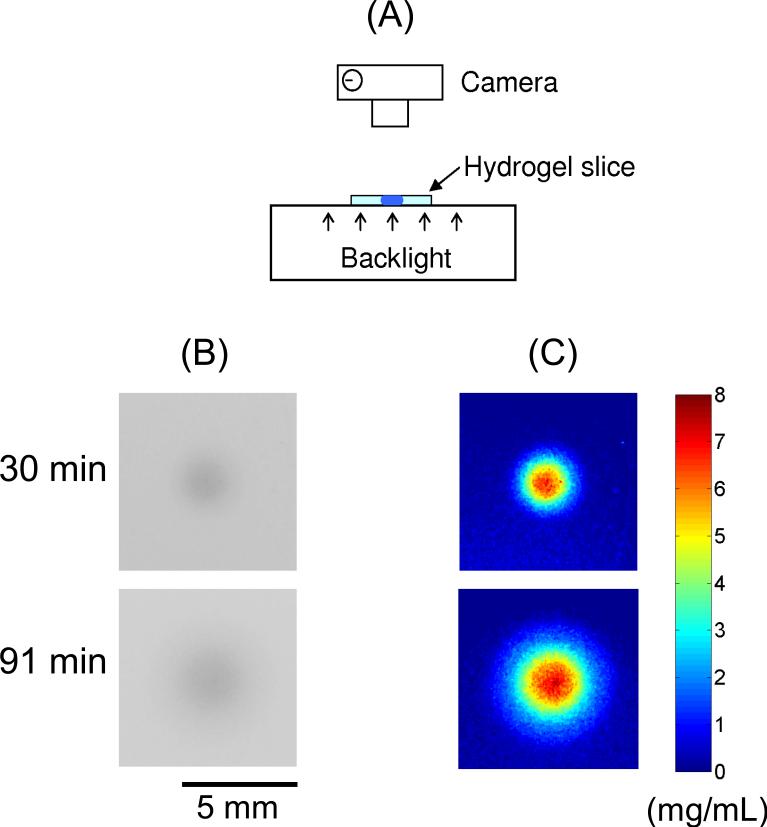
Figure 2.
Schematic of the optical imaging method used to measure the concentration of Evans blue labeled Gd-Albumin in the hydrogel slice is shown in (A). Part (B) shows recorded grayscale optical images and part (C) shows the calculated concentration maps. The conversion from the pixel intensity to the dye concentration was based on Beer's law [27].

