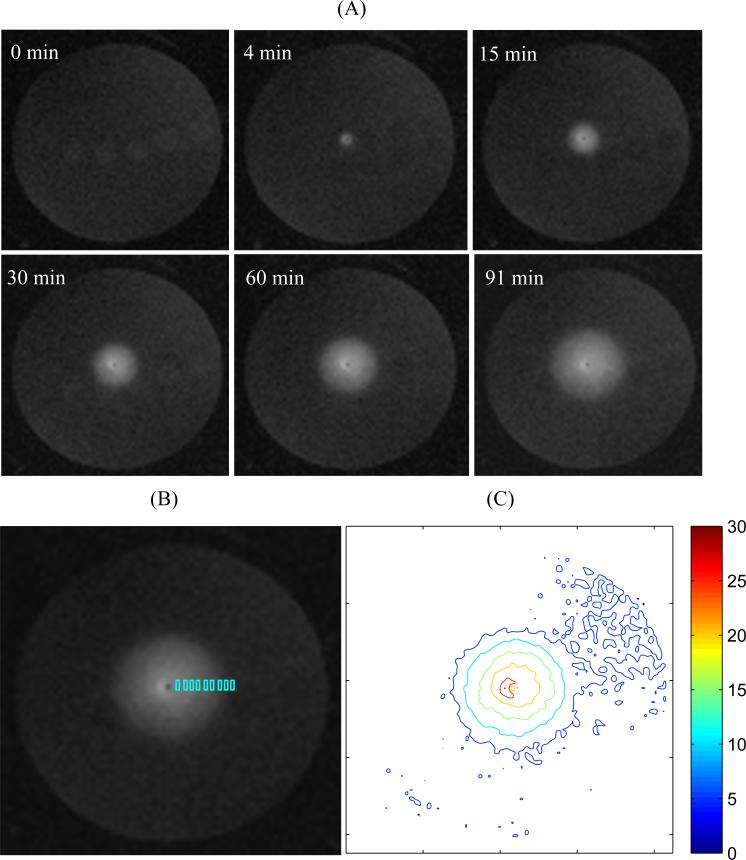
Figure 4.
(A) Evolution of T1-weighted MR signal during infusion of Gd-Albumin into 1% agarose hydrogel at a rate of 0.29 μL/min (transverse image at approximate center of infusion site; the cannula is perpendicular to the transverse plane; slice thickness = 1 mm). (B) The signal profile in radial direction was obtained by sampling in the small rectangular regions of interest (ROIs) (~20 pixels in each rectangle). The final signal profile was obtained by sampling in the orthogonal directions symmetric around the infusion site. This figure only shows the sampling in the positive horizontal direction. The infusion cannula/site was identified by a black dot in the image center. (C) Contours of MR signal intensity at time = 91 min.

