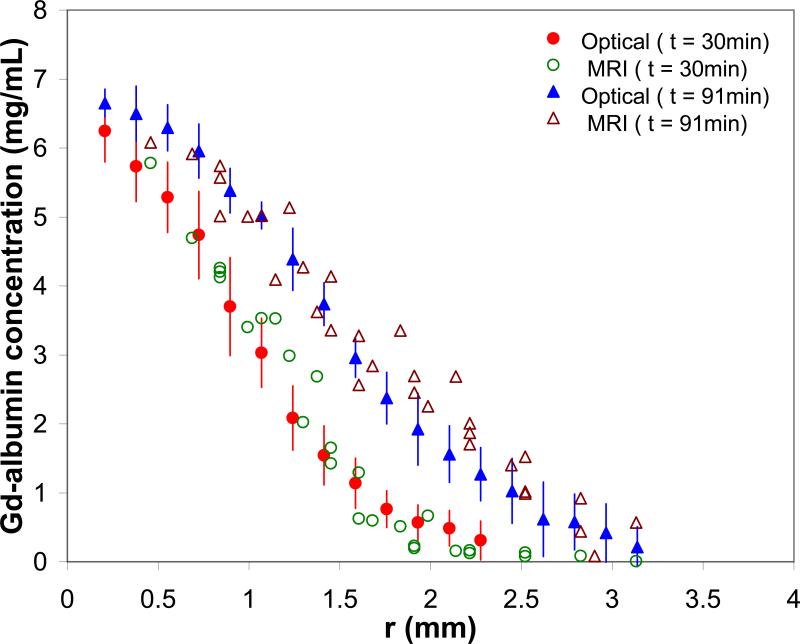
Figure 5.
MR-derived concentration of Evans blue labeled Gd-Albumin compared with profiles measured directly using quantitative optical imaging in a 1 mm thick hydrogel slice. R2 = 0.94 and 0.92 at time = 30 and 91 min, respectively. Error bars are the standard deviation (n = 12) of the optical measures.

